- Analytics
- Technical Analysis
BMW Technical Analysis - BMW Trading: 2017-07-17
Bayerische Motoren Werke increased car sales
BMW Group increased car sales both in June 2017 and in the first half of the year, and also published a good operating report. Will the BMW stock prices grow?
In the first half of 2017, car sales of the Group's major brands (BMW, MINI and Rolls-Royce) increased by 5% amounting to 1.22 mln units. Of these units, 1.04 mln cars were sold outside Germany. The overall increase in sales in June was 2.1% to 232.6 thousand cars. The main increase was demonstrated by the brands BMW X1 (+ 45.2%), BMW X5 (+ 10.6%), BMW 1 Series (+ 6.5%) and BMW 7 Series (+ 26.9%). The sales of electric models BMW i increased by 79.8% to 51.7 thousand. This is a particularly positive factor for the company in connection with the planned easing of the entry rules for imported electric cars to China. The main countries with increased total sales of BMW were China (+ 18.4%), Japan (+ 6.4%) and Mexico (+ 15.4%). The subsidiary company BMW Brilliance Automotive opened a new service center in China, which became an additional positive for the prices.
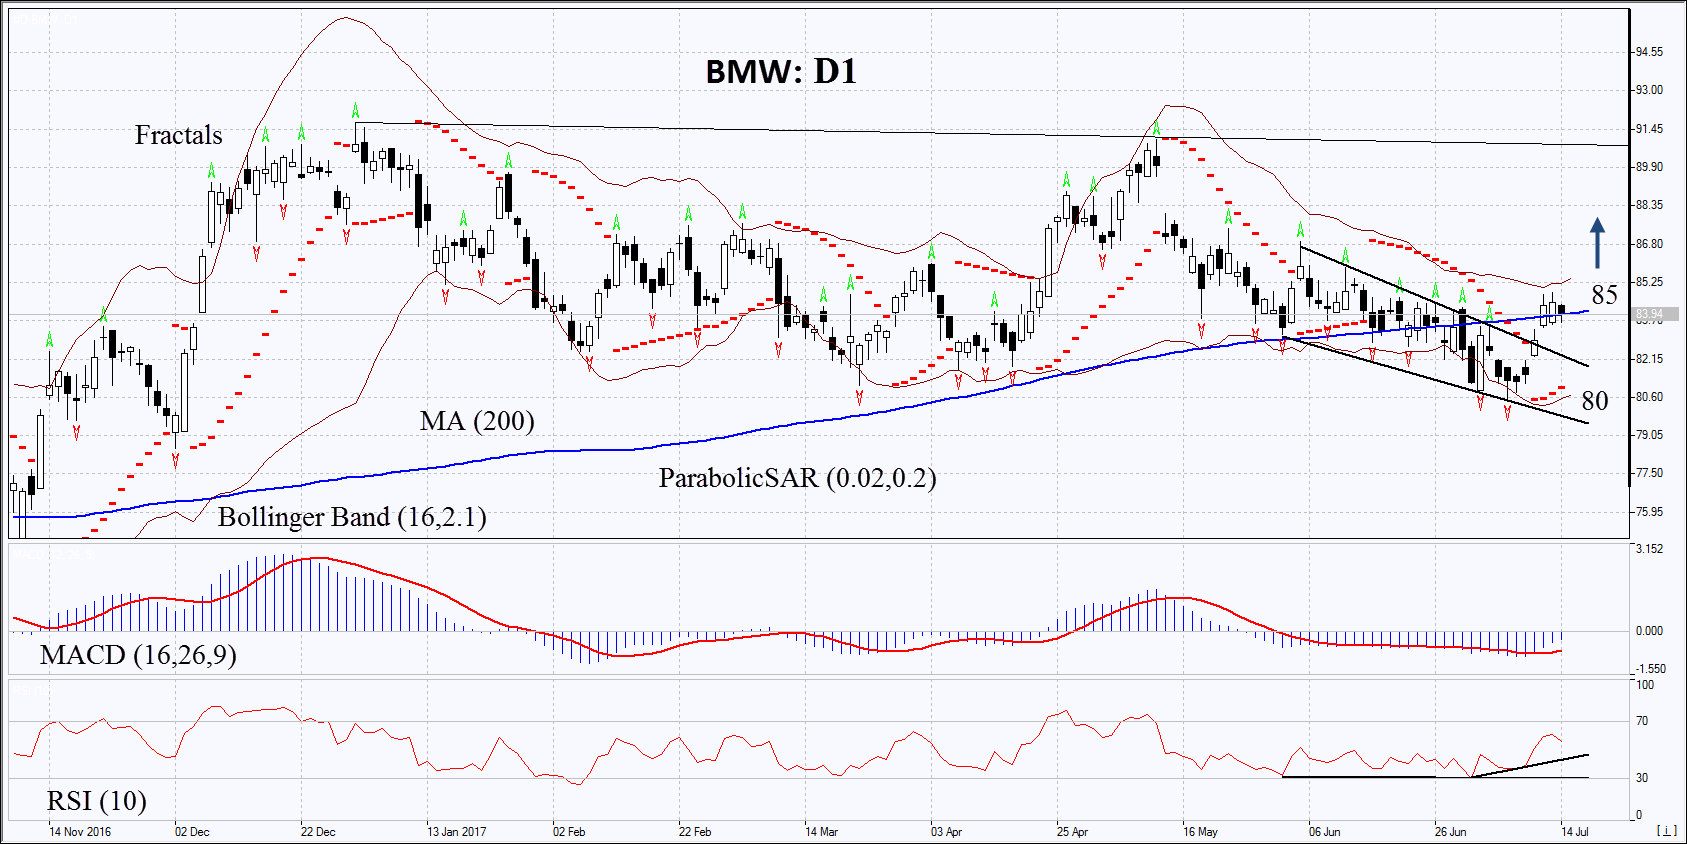
On the daily timeframe, BMW: D1 breached out of the downtrend and exceeded the 200-day moving average line. The further price increase is possible in case of the publication of positive corporate report, as well as in case of the total growth of the German stock index DAX.
- The Parabolic indicator gives a bullish signal.
- The Bollinger bands have widened, which means lower volatility. They are tilted upwards.
- The RSI is above 50. It has formed a positive divergence.
- The MACD gives a bullish signal.
The bearish momentum may develop in case BMW exceeds the upper Bollinger band at 85. This level may serve as an entry point. The initial stop loss may be placed below the last fractal low, the Parabolic signal, the lower Bollinger band and the 7-month low at 80. After opening the pending order, we shall move the stop to the next fractal low following the Bollinger and Parabolic signals. Thus, we are changing the potential profit/loss to the breakeven point. More risk-averse traders may switch to the 4-hour chart after the trade and place there a stop loss moving it in the direction of the trade. If the price meets the stop level at 80 without reaching the order at 85 we recommend cancelling the position: the market sustains internal changes that were not taken into account.
Summary of technical analysis
| Position | Buy |
| Buy stop | above 85 |
| Stop loss | below 80 |
Explore our
Trading Conditions
- Spreads from 0.0 pip
- 30,000+ Trading Instruments
- Stop Out Level - Only 10%
Ready to Trade?
Open Account Note:
This overview has an informative and tutorial character and is published for free. All the data, included in the overview, are received from public sources, recognized as more or less reliable. Moreover, there is no guarantee that the indicated information is full and precise. Overviews are not updated. The whole information in each overview, including opinion, indicators, charts and anything else, is provided only for familiarization purposes and is not financial advice or а recommendation. The whole text and its any part, as well as the charts cannot be considered as an offer to make a deal with any asset. IFC Markets and its employees under any circumstances are not liable for any action taken by someone else during or after reading the overview.
