- Analytics
- Technical Analysis
Cotton Technical Analysis - Cotton Trading: 2018-09-28
Weak Chinese demand bearish for cotton prices
Slow sales at China state cotton reserve auction signals weak demand in China. Will the cotton price continue declining?
China sold 13,200 tons of cotton at auction of state reserves at an average price of 14,624 yuan ($2,127.72) per ton on September 26. Only 40% of cotton available for the auction found a buyer. China holds daily auctions running through September 30 starting from spring to ensure ample supply for domestic consumption. It is the top cotton importer in the world, China accounted for 17.3% of global cotton imports in 2017. The second biggest importer – Bangladesh, imported 10.7% of global imports of the fiber. Tepid sales at China’s state reserves auction signals weak domestic demand for cotton, which is bearish for cotton prices.
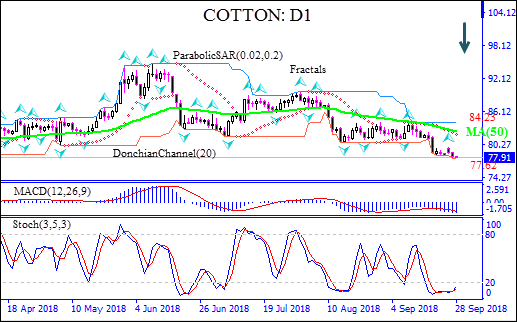
On the daily timeframe the COTTON: D1 is below the 50-day moving average MA(50) which is falling, this is bearish.
- The Parabolic indicator gives a sell signal.
- The Donchian channel indicates downtrend: it is widening downward.
- The MACD indicator gives a bearish signal: it is below the signal line and the gap is widening.
- The Stochastic oscillator has breached into the oversold zone, this is bullish.
We believe the bearish momentum will continue after the price breaches below the lower boundary of Donchian channel at 77.62. This level can be used as an entry point for placing a pending order to sell. The stop loss can be placed above the upper Donchian boundary at 84.23. After placing the order, the stop loss is to be moved every day to the next fractal high, following Parabolic signals. Thus, we are changing the probable profit/loss ratio to the breakeven point. If the price meets the stop loss level (84.23) without reaching the order (77.62), we recommend cancelling the order: the market has undergone internal changes which were not taken into account.
Technical Analysis Summary
| Position | Sell |
| Sell stop | Below 77.62 |
| Stop loss | Above 84.23 |
Explore our
Trading Conditions
- Spreads from 0.0 pip
- 30,000+ Trading Instruments
- Stop Out Level - Only 10%
Ready to Trade?
Open Account Note:
This overview has an informative and tutorial character and is published for free. All the data, included in the overview, are received from public sources, recognized as more or less reliable. Moreover, there is no guarantee that the indicated information is full and precise. Overviews are not updated. The whole information in each overview, including opinion, indicators, charts and anything else, is provided only for familiarization purposes and is not financial advice or а recommendation. The whole text and its any part, as well as the charts cannot be considered as an offer to make a deal with any asset. IFC Markets and its employees under any circumstances are not liable for any action taken by someone else during or after reading the overview.
