- Analytics
- Technical Analysis
EU 50 Index Technical Analysis - EU 50 Index Trading: 2018-10-04
Lower euro-zone unemployment bullish EU50
Euro-zone unemployment fell in August while inflation edged higher. Will the EU50 recovery continue?
Recent euro-zone economic data were mostly positive: headline inflation upticked to 2.1% in September from 2%, unemployment declined in August to 8.1% from 8.2%, and retail sales rose more than expected in August - 1.8% over year from 1.7% in previous month when 1.7% growth was expected. Positive euro-zone data are bullish for EU500. However the newly revealed Italy’s government plan of bigger than expected budget deficit of 2.4% of GDP for 2019 is a downside risk which may weigh on euro-zone growth prospects.
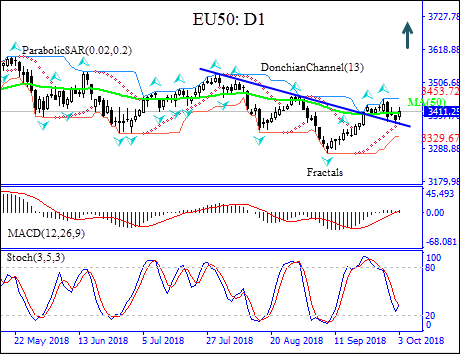
On the daily timeframe EU50: D1 is retracing higher after bouncing off the resistance turned support line. The price is attempting to breach above the 50-day moving average MA(50).
- The Parabolic indicator has formed a buy signal.
- The Donchian channel indicates no trend yet: it is flat.
- The MACD indicator is above the signal line with the gap widening. This is a bullish signal.
- The stochastic oscillator is rising but has not reached the overbought zone yet.
We believe the bullish momentum will continue after the price breaches above the upper Donchian boundary at 3453.72. This level can be used as an entry point for placing a pending order to buy. The stop loss can be placed below the lower Donchian channel at 3329.67. After placing the pending order the stop loss is to be moved every day to the next fractal low, following Parabolic signals. Thus, we are changing the probable profit/loss ratio to the breakeven point. If the price meets the stop-loss level (3329.67) without reaching the order (3453.72) we recommend cancelling the order: the market sustains internal changes which were not taken into account.
Technical Analysis Summary
| Position | Buy |
| Buy Stop | Above 3453.72 |
| Stop loss | Below 3329.67 |
Explore our
Trading Conditions
- Spreads from 0.0 pip
- 30,000+ Trading Instruments
- Stop Out Level - Only 10%
Ready to Trade?
Open Account Note:
This overview has an informative and tutorial character and is published for free. All the data, included in the overview, are received from public sources, recognized as more or less reliable. Moreover, there is no guarantee that the indicated information is full and precise. Overviews are not updated. The whole information in each overview, including opinion, indicators, charts and anything else, is provided only for familiarization purposes and is not financial advice or а recommendation. The whole text and its any part, as well as the charts cannot be considered as an offer to make a deal with any asset. IFC Markets and its employees under any circumstances are not liable for any action taken by someone else during or after reading the overview.
