- Analytics
- Technical Analysis
EUR CHF Technical Analysis - EUR CHF Trading: 2019-08-27
US and China are ready for new trade negotiations
Global risks fell slightly due to signs of normalization of US-China trade relations. Will the EURCHF quotations grow?
The upward movement indicates the appreciation of the euro and the weakening of the Swiss franc. Frank, along with the Japanese yen, is often regarded by investors as a currency - a refuge in the event of increased risks in world politics or the economy. US President Donald Trump said on the sidelines of the G7 summit that Chinese officials are ready for a new discussion of mutual duties. At the same time, Vice Premier Liu He said that China is ready to resolve the trade dispute through "calm" negotiations. If such negotiations are successful, global risks can decrease and lower the attractiveness of the Swiss franc. Employment data for non-farm payrolls for the 2nd quarter of 2019, which may affect the dynamics of the franc, will be released on August 29 in Switzerland. For the euro, significant statistics will be published on the same day: unemployment and inflation in Germany in August. On Friday, inflation in the Eurozone.
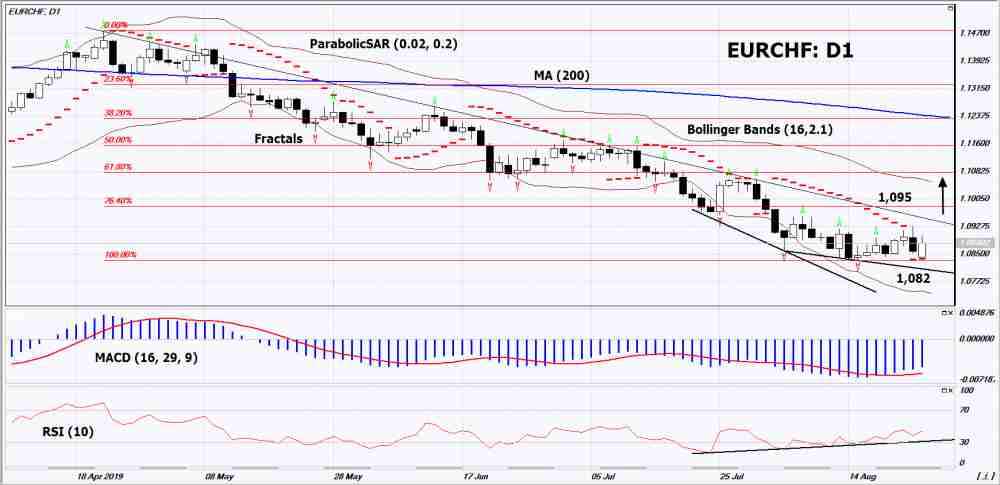
On the daily timeframe EURCHF: D1 adjusted upward, but before opening a buy position, a downtrend resistance line should be broken. Various technical analysis have generated signals to increase. Further growth of quotations is possible in case of positive news in the EU and success in the US-Chinese trade negotiations.
- The Parabolic indicator demonstrates a signal to increase.
- The Bolinger bands greatly expanded, indicating high volatility.
- The RSI indicator is below 50. It has formed a double divergence to increase.
- The MACD indicator gives a bullish signal. The bullish momentum may develop if EURCHF exceeds the last two upper fractals: 1,095. This level can be used as an entry point. Initial stop lose may be placed below the last lower fractal, Parabolic signal and 2-year low: 1.082. After opening the pending order, the stop shall be moved following the Bollinger and Parabolic signals to the next fractal minimum. Thus, we are changing the potential profit/loss to the breakeven point. More risk-averse traders may switch to the 4-hour chart after the trade and place a stop loss moving it in the direction of the trade. If the price meets the stop level (1,082) without reaching the order (1,095), we recommend to cancel the order: the market sustains internal changes that were not taken into account.
Technical Analysis Summary
| Position | Buy |
| Buy stop | Above 1,095 |
| Stop loss | Below 1,082 |
Explore our
Trading Conditions
- Spreads from 0.0 pip
- 30,000+ Trading Instruments
- Stop Out Level - Only 10%
Ready to Trade?
Open Account Note:
This overview has an informative and tutorial character and is published for free. All the data, included in the overview, are received from public sources, recognized as more or less reliable. Moreover, there is no guarantee that the indicated information is full and precise. Overviews are not updated. The whole information in each overview, including opinion, indicators, charts and anything else, is provided only for familiarization purposes and is not financial advice or а recommendation. The whole text and its any part, as well as the charts cannot be considered as an offer to make a deal with any asset. IFC Markets and its employees under any circumstances are not liable for any action taken by someone else during or after reading the overview.
