- Analytics
- Technical Analysis
Euro Currency Index Technical Analysis - Euro Currency Index Trading: 2019-10-16
Getting ready for the ECB meeting next week
In this review, we suggest to consider a personal composite instrument (PCI) & EUR_Index. It reflects the dynamics of changes in the value of the euro relative to other world currencies.Will the EUR_Index quotations grow?The growth of this PCI indicates the strengthening of the single European currency. The main factor for this could be a stable positive trade balance of the Eurozone, amounting to about 20 billion euros per month. The positive trend can continue. According to the Center for European Economic Research (ZEW), business activity in Germany increased significantly in October. Next week, on October 24, the next meeting of the ECB will be held. Accordingly, this week, a number of representatives of the European regulator are expected to speak, which may affect the dynamics of the euro.
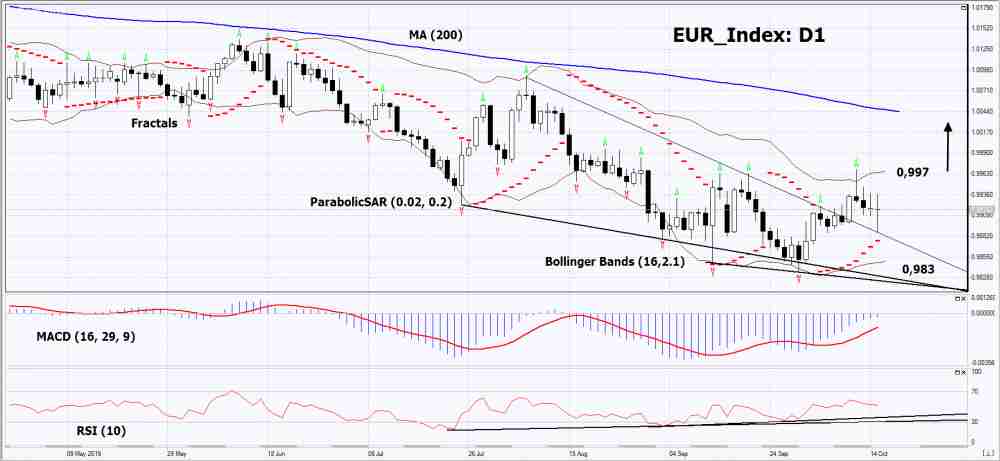
On the daily timeframe EUR_Index: D1 moved into a short-term neutral trend. Various technical analysis indicators have generated signals to increase. Further growth of quotations is possible if positive macroeconomic indicators are published in the EU and the current ECB policy is maintained.
- The Parabolic indicator gives a bullish signal.
- The Bolinger bands widened, indicating high volatility. Both Bollinger Lines Slope Up .
- The RSI indicator is above the 50 mark. It has formed a divergence to increase.
- The MACD indicator shows a signal to increase.
The bullish momentum may develop if EUR_Index exceeds its last upper fractal and the upper Bollinger line: 0.997. This level can be used as an entry point. Initial stop lose may be placed below the last lower fractal, the lower Bollinger line and the Parabolic signal: 0.983. After opening the pending order, the stop shall be moved following the Bollinger and Parabolic signals to the next fractal minimum. Thus, we are changing the potential profit/loss to the breakeven point. More risk-averse traders may switch to the 4-hour chart after the trade and place a stop loss moving it in the direction of the trade. If the price meets the stop level (0,983) without reaching the order (0,997), we recommend to cancel the order: the market sustains internal changes that were not taken into account.
Technical Analysis Summary
| Position | Buy |
| Buy stop | Above 0,997 |
| Stop loss | Below 0,983 |
Explore our
Trading Conditions
- Spreads from 0.0 pip
- 30,000+ Trading Instruments
- Stop Out Level - Only 10%
Ready to Trade?
Open Account Note:
This overview has an informative and tutorial character and is published for free. All the data, included in the overview, are received from public sources, recognized as more or less reliable. Moreover, there is no guarantee that the indicated information is full and precise. Overviews are not updated. The whole information in each overview, including opinion, indicators, charts and anything else, is provided only for familiarization purposes and is not financial advice or а recommendation. The whole text and its any part, as well as the charts cannot be considered as an offer to make a deal with any asset. IFC Markets and its employees under any circumstances are not liable for any action taken by someone else during or after reading the overview.
