- Analytics
- Technical Analysis
FR 40 Technical Analysis - FR 40 Trading: 2018-06-22
Weaker French data bearish for FR40
Expansion in French manufacturing and services sectors slowed in May. Will the FR 40 continue declining?
Recent French economic data were negative after the first quarter GDP was to 0.2% from 0.3% of the first reading. Retail sales fell 1.2% over month in April. Industrial production decline accelerated to 0.5% over month in April from 0.4% in March. The current account deficit widened in April to €1.1 billion from €0.6 billion in March. And the composite purchasing managers’ index reported by Markit declined to 54.2 in May from 56.9 in April, indicating slowing of economic activities. Furthermore, French growth is expected to slow to 1.7% after hitting a decade high of 2.3% percent last year, French INSEE statistics agency said in its quarterly economic outlook. Deteriorating economic data are bearish for French stock index FR 40.
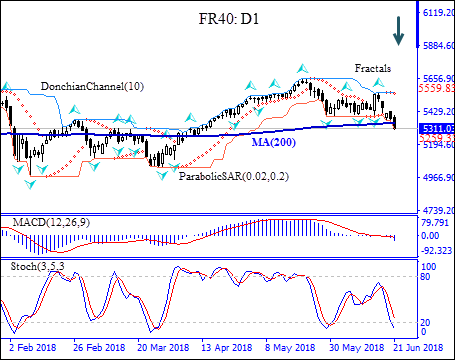
On the daily timeframe the FR40: D1 has breached below the 200-day moving average MA(200) which is still rising, this is bearish.
- The Parabolic indicator gives a sell signal.
- The Donchian channel indicates downtrend: it is tilted lower.
- The MACD indicator gives a bearish signal: it is below the signal line and the gap is widening.
- The Stochastic oscillator has breached into the oversold zone, this is bullish.
We believe the bearish momentum will continue after the price closes below the lower boundary of Donchian channel at 5259.33. This level can be used as an entry point for placing a pending order to sell. The stop loss can be placed above the last fractal high at 5559.83. After placing the order, the stop loss is to be moved every day to the next fractal high, following Parabolic signals. Thus, we are changing the probable profit/loss ratio to the breakeven point. If the price meets the stop loss level (5559.83) without reaching the order (5259.33), we recommend cancelling the order: the market has undergone internal changes which were not taken into account.
Technical Analysis Summary
| Position | Sell |
| Sell stop | Below 5259.33 |
| Stop loss | Above 5559.83 |
Explore our
Trading Conditions
- Spreads from 0.0 pip
- 30,000+ Trading Instruments
- Stop Out Level - Only 10%
Ready to Trade?
Open Account Note:
This overview has an informative and tutorial character and is published for free. All the data, included in the overview, are received from public sources, recognized as more or less reliable. Moreover, there is no guarantee that the indicated information is full and precise. Overviews are not updated. The whole information in each overview, including opinion, indicators, charts and anything else, is provided only for familiarization purposes and is not financial advice or а recommendation. The whole text and its any part, as well as the charts cannot be considered as an offer to make a deal with any asset. IFC Markets and its employees under any circumstances are not liable for any action taken by someone else during or after reading the overview.
