- Analytics
- Technical Analysis
GB 100 Index Technical Analysis - GB 100 Index Trading: 2017-09-12
Improving growth bullish for UK market
UK manufacturing production and GDP accelerated recently. Will the GB 100 index advance?
UK economic data improved recently. The 0.5% increase on month in manufacturing production in the UK in July was above expectations for a 0.3% gain. Industrial production was up 0.2%, in line with expectations. And the National Institute of Economic and Social Research reported that GDP grew by 0.4% in the three months ending in August 2017 after growth of 0.2% in the three months to July. However, construction output for the same month was down 0.9%. Improving growth is bullish for British Pound.
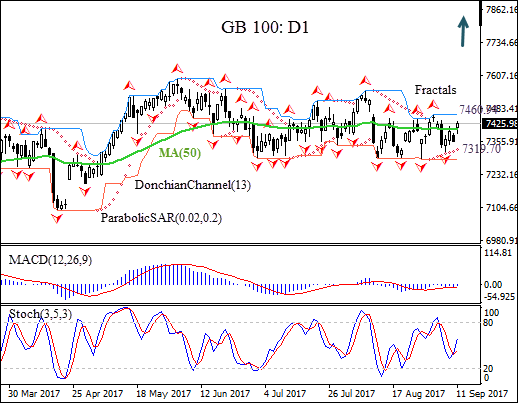
On the daily chart GB100: D1 has closed above the 50-day moving average MA(50).
- The Parabolic indicator has formed a buy signal.
- The Donchian channel indicates no trend yet: it is flat.
- The MACD indicator is below the signal line with the gap narrowing. This is a bullish signal.
- The stochastic oscillator is rising but hasn’t crossed into overbought zone yet.
We believe the bullish momentum will continue after the price breaches above the upper Donchian boundary at 7460.94, confirmed also by fractal high. The stop loss can be placed below the last fractal low at 7319.70. After placing the pending order the stop loss is to be moved every day to the next fractal low, following Parabolic signals. Thus, we are changing the probable profit/loss ratio to the breakeven point. If the price meets the stop-loss level (7319.70) without reaching the order (7460.94) we recommend cancelling the position: the market sustains internal changes which were not taken into account.
Technical Analysis Summary
| Position | Buy |
| Buy Stop | Above 7460.94 |
| Stop loss | Below 7319.70 |
- Get Certificate

Note:
This overview has an informative and tutorial character and is published for free. All the data, included in the overview, are received from public sources, recognized as more or less reliable. Moreover, there is no guarantee that the indicated information is full and precise. Overviews are not updated. The whole information in each overview, including opinion, indicators, charts and anything else, is provided only for familiarization purposes and is not financial advice or а recommendation. The whole text and its any part, as well as the charts cannot be considered as an offer to make a deal with any asset. IFC Markets and its employees under any circumstances are not liable for any action taken by someone else during or after reading the overview.
