- Analytics
- Technical Analysis
GBP AUD Technical Analysis - GBP AUD Trading: 2018-10-23
There are disagreements under the terms the Brexit again
In this review, we want to consider the dynamics of the currency pair British Pound against the Australian dollar. Is there a possibility for GBPAUD quotes to reduce?
Downward movement means the weakening of the British pound against the Australian dollar. The disagreement over the conditions of the UK exit from the European Union have a negative impact on the pound. The British Prime Minister Theresa May announced that she is against the extension of the transition period. The Brexit should happen March 29, 2019. There is a risk that final agreements between the UK and the EU will not be signed. The quotes of the Australian dollar are growing due to the rise in prices for export goods and high demand from China.
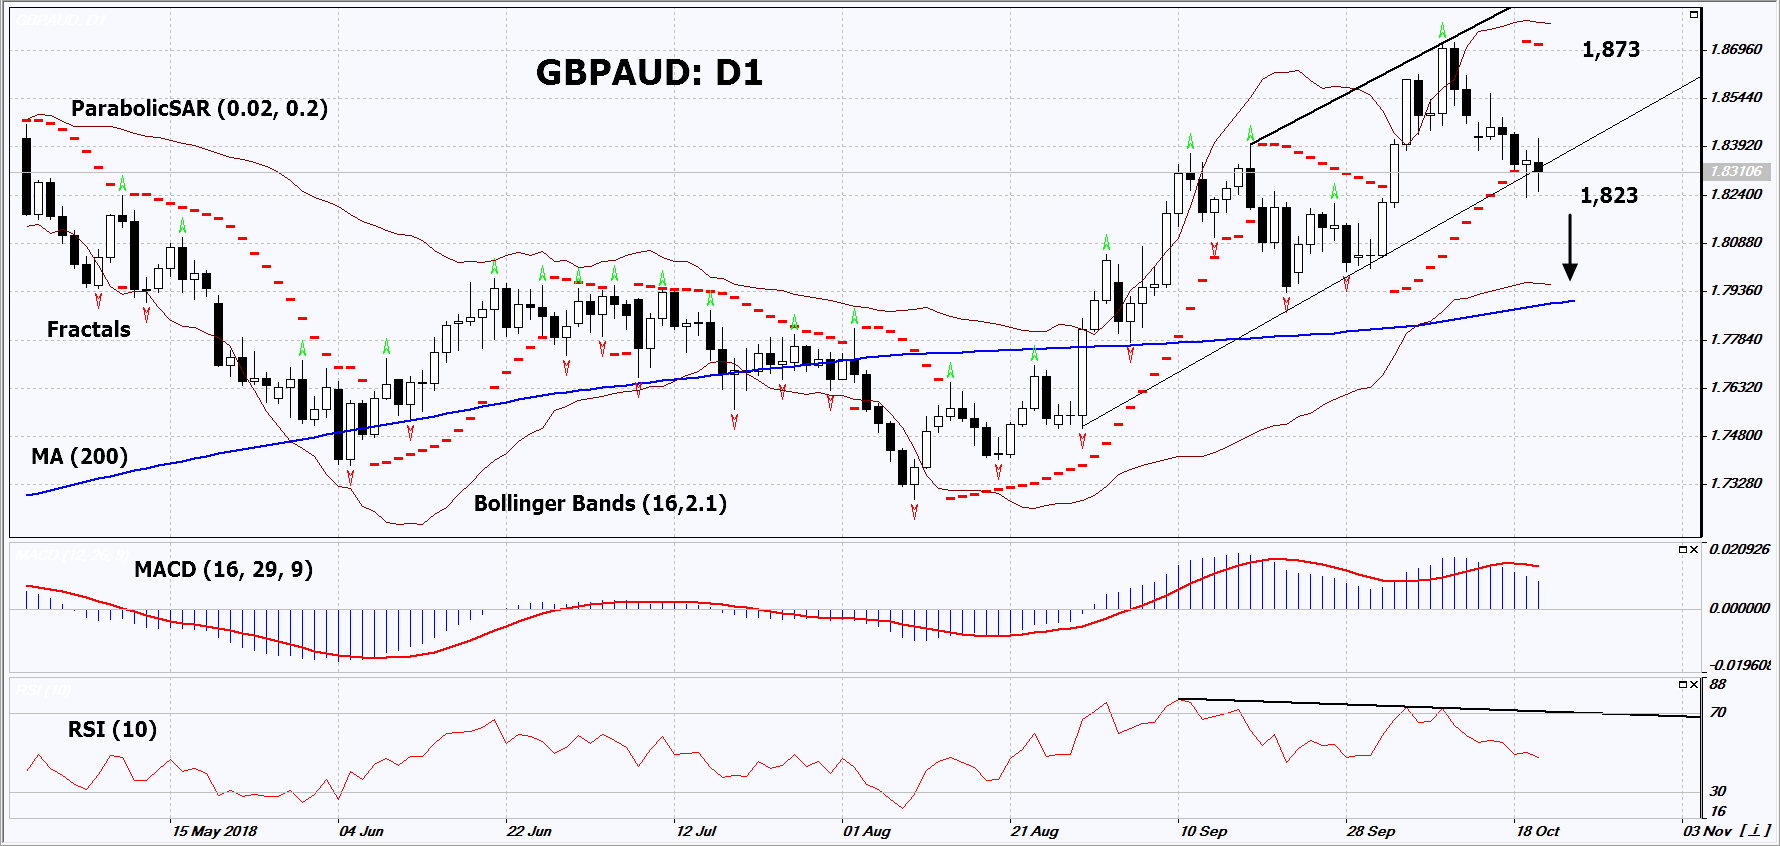
On the daily timeframe, GBPAUD: D1 left the uptrend and is trying to adjust downwards from a june 2016 high. The further price decrease is possible in case of the publication of positive economic news in Australia, and negative one in the UK.
- The Parabolic indicator gives a bearish signal.
- TheBollinger bands have widened, which indicates high volatility. They are titled downward.
- The RSI indicator is below 50. It has formed a negative divergence.
- The MACD indicator gives bearish signals.
The bearish momentum may develop in case GBPAUDfalls below its last low at 1,823. This level may serve as an entry point. The initial stop loss may be placed above the last fractal highs, the 2-year high and the Parabolic signal at 1,873. After opening the pending order, we shall move the stop to the next fractal high following the Bollinger and Parabolic signals. Thus, we are changing the potential profit/loss to the breakeven point. More risk-averse traders may switch to the 4-hour chart after the trade and place there a stop loss moving it in the direction of the trade. If the price meets the stop level (1,873) without reaching the order (1,823), we recommend to close the position: the market sustains internal changes that were not taken into account.
Summary of technical analysis
| Position | Sell |
| Sell stop | Below 1,823 |
| Stop loss | Above 1,873 |
- Get Certificate

Note:
This overview has an informative and tutorial character and is published for free. All the data, included in the overview, are received from public sources, recognized as more or less reliable. Moreover, there is no guarantee that the indicated information is full and precise. Overviews are not updated. The whole information in each overview, including opinion, indicators, charts and anything else, is provided only for familiarization purposes and is not financial advice or а recommendation. The whole text and its any part, as well as the charts cannot be considered as an offer to make a deal with any asset. IFC Markets and its employees under any circumstances are not liable for any action taken by someone else during or after reading the overview.
