- Analytics
- Technical Analysis
GBP USD Technical Analysis - GBP USD Trading: 2014-10-07
British pound Versus US Dollar
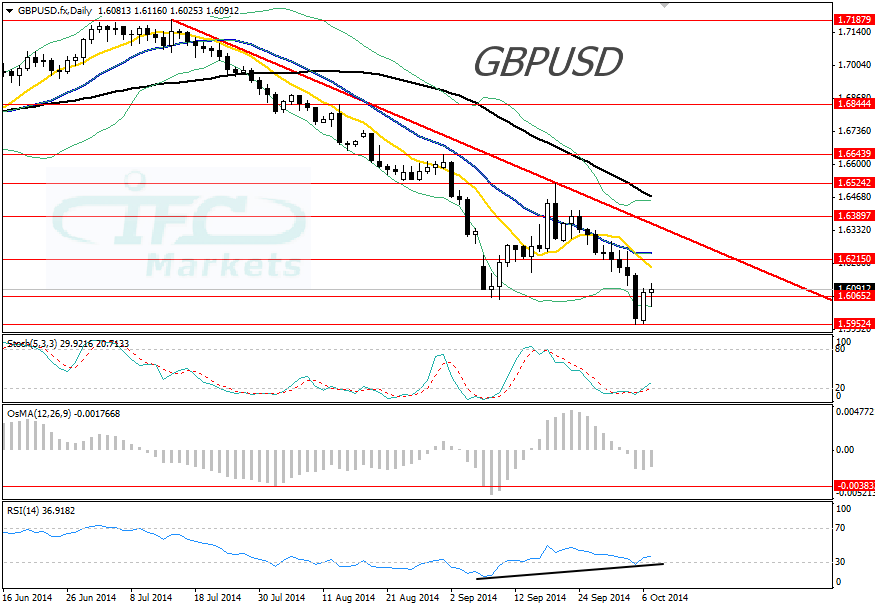
Hello dear traders. Today we are going to analyze the sterling against the greenback forex couple. As we can see at the daily chart the currency pair is down trending and has recently made a lower low at 1.5952 which is an 11-month low prices but quickly recovered and is currently trading at 1.6094. Prices rebounded above the previous to support at 1.6065 most likely due to oversold indicators as well as investors were covering short positions. Downside bias revived after a retracement from 1.6065 to 1.6524 where the valid falling trend line is placed. That retracement triggered after the Scotland vote for No independency, however stronger US employment weighed on the currency couple. Falling trend line suggests that bearish potential remains strong coupled by the 10, 20 and 50 Simple Moving Averages being well above prices. The question here is, will this well extended bearish wave continue or a bounce up? Looking ahead, the US FOMC meeting minutes expected by the end of Wednesday could increase selling pressure on the GBPUSD and at the same time we are focusing on the Bank of England monetary decision.
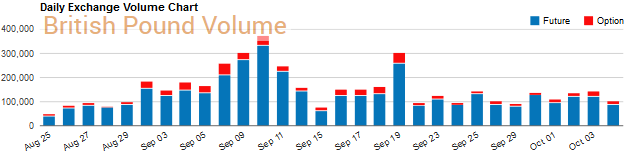
At the below chart we can see the daily volumes of futures and options traded on the Chicago Mercantile Exchange. We can see that on the last trading sessions the volume for the British pound decreased substantially while prices were making a lower low. That is actually indicating that the new low is not validated by the volume analysis.
Looking at the oscillators, the Stochastic is currently recovering above the oversold zone, the OsMA has reset to zero line and is falling suggesting that the risk is turning to lower levels. However, the RSI (14) provides a bearish divergence signal and that suggests the lower penetration of the prices has been a “bear trap” pattern. In our opinion, the GBPUSD has obviously touched at extreme low at 1.5952 and as we see it bounced up. Technically the falling structure is strong however not supported by volume and oscillators. We consider the bounce up provides another chance to short the GBPUSD however we consider that we are near a bottom and thus the short positioning is too risky. We expect to see another bottom around the support at the 161.8% Fibonacci extension of 1.6065 to 1.6524, at 1.5766. Also, the fundamental developments could trigger further selling wave.
Explore our
Trading Conditions
- Spreads from 0.0 pip
- 30,000+ Trading Instruments
- Stop Out Level - Only 10%
Ready to Trade?
Open Account Note:
This overview has an informative and tutorial character and is published for free. All the data, included in the overview, are received from public sources, recognized as more or less reliable. Moreover, there is no guarantee that the indicated information is full and precise. Overviews are not updated. The whole information in each overview, including opinion, indicators, charts and anything else, is provided only for familiarization purposes and is not financial advice or а recommendation. The whole text and its any part, as well as the charts cannot be considered as an offer to make a deal with any asset. IFC Markets and its employees under any circumstances are not liable for any action taken by someone else during or after reading the overview.
