- Analytics
- Technical Analysis
INTC Technical Analysis - INTC Trading: 2019-05-10
Lower profit expectations bearish for Intel prices
Intel Corporation lowered its profit growth forecast for 2020-23. Will the Intel Corp price continue declining?
Intel Corporation’s shares declined 2.5% on Wednesday after the chipmaker forecast modest profit growth over the next three years. The company forecast to have just 28% market share by 2023, or about $85 billion in sales in a $300 billion market for the chips it makes. Two weeks earlier the stock fell more than 7% after the company said it expected full year revenue of $69.0 billion, a decline from $70.8 billion in 2018. It would be the company's first revenue drop since 2015. Stock price tumbled despite the fact that company's first-quarter earnings exceeded forecasts: $0.89 cents instead of $0.87 per share. Lower revenue estimate is bearish for Intel stock price.
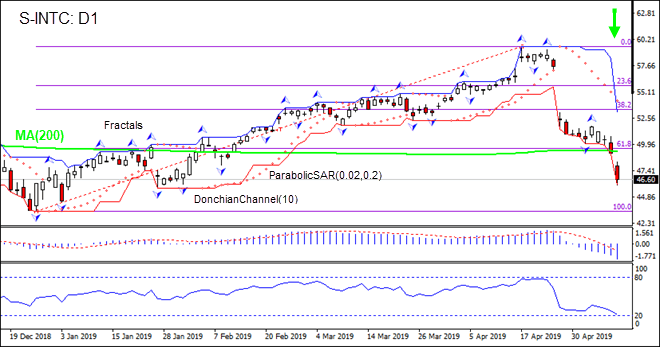
On the daily timeframe the S-INTC: D1 has breached below the 200-day moving average MA(200) and Fibonacci 61.8. This is bearish.
- The Parabolic indicator gives a sell signal.
- The Donchian channel indicates downtrend: it is tilted lower.
- The MACD indicator gives a bearish signal: it is below the signal line and the gap is widening.
- The RSI oscillator is falling but has not breached into the oversold zone yet.
We believe the bearish momentum will continue after the price breaches below the lower boundary of Donchian channel at 46.04. This level can be used as an entry point for placing a pending order to sell. The stop loss can be placed above the fractal high at 51.79. After placing the order, the stop loss is to be moved every day to the next fractal high, following Parabolic signals. Thus, we are changing the expected profit/loss ratio to the breakeven point. If the price meets the stop loss level (51.79) without reaching the order (46.04), we recommend cancelling the order: the market has undergone internal changes which were not taken into account.
Technical Analysis Summary
| Position | Sell |
| Sell stop | Below 46.04 |
| Stop loss | Above 51.79 |
Explore our
Trading Conditions
- Spreads from 0.0 pip
- 30,000+ Trading Instruments
- Stop Out Level - Only 10%
Ready to Trade?
Open Account Note:
This overview has an informative and tutorial character and is published for free. All the data, included in the overview, are received from public sources, recognized as more or less reliable. Moreover, there is no guarantee that the indicated information is full and precise. Overviews are not updated. The whole information in each overview, including opinion, indicators, charts and anything else, is provided only for familiarization purposes and is not financial advice or а recommendation. The whole text and its any part, as well as the charts cannot be considered as an offer to make a deal with any asset. IFC Markets and its employees under any circumstances are not liable for any action taken by someone else during or after reading the overview.
