- Analytics
- Technical Analysis
Natural Gas vs Oil Technical Analysis - Natural Gas vs Oil Trading: 2018-07-17
Oil prices are falling due to an increase in production
In this review, we suggest considering the personal composite instrument (PCI) &GAS/OIL. It reflects the price change dynamics of the US natural gas against the US light crude oil West Texas Intermediate (WTI). Will GAS/OIL prices rise?
Their increase means that natural gas is in greater demand than oil. Currently, oil prices are falling, as OPEC and non-OPEC producer increased the production by 1 million barrels per day. An additional negative factor for the market may be the expected increase in oil production in Libya. The extraction of natural gas in the US is now at a historic high. However, it is in good demand for generating electricity. In turn, the increased power consumption is due to the usage of a large number of air conditioners amid hot weather in the United States. The US reserves of natural gas now amount to 2.262 trillion cubic feet, which is 18.8% below the 5-year average.
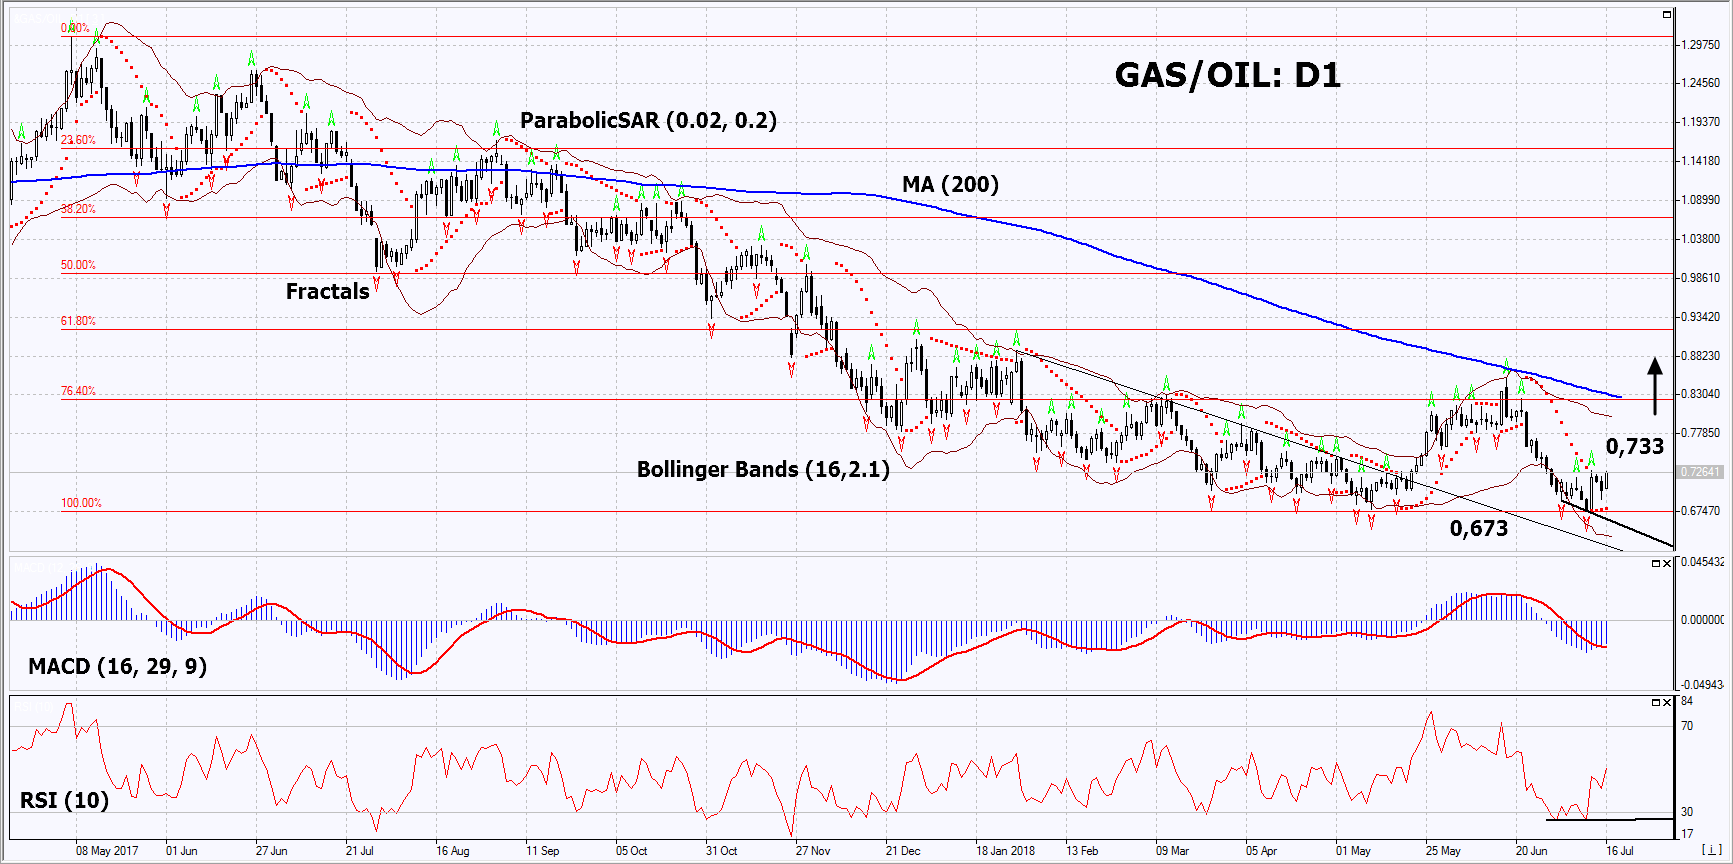
On the daily timeframe, GAS/OIL: D1 formed a double bottom and left the falling channel. A number of technical analysis indicators formed buy signals. The further price growth is possible in case of an increase in demand for natural gas in the US and an increase in world oil production.
- The Parabolic indicator gives a bullish signal.
- The Bollinger bands have widened, which indicates high volatility.
- The RSI indicator is below 50. It has formed a positive divergence.
- The MACD indicator gives a bullish signal.
The bullish momentum may develop in case GAS/OIL exceeds the last fractal high at 0.733. This level may serve as an entry point. The initial stop loss may be placed below the last fractal low, the 4-year low and the Parabolic signal at 0.673. After opening the pending order, we shall move the stop to the next fractal low following the Bollinger and Parabolic signals. Thus, we are changing the potential profit/loss to the breakeven point. More risk-averse traders may switch to the 4-hour chart after the trade and place there a stop loss moving it in the direction of the trade. If the price meets the stop level (0.673) without reaching the order (0.733), we recommend to close the position: the market sustains internal changes that were not taken into account.
Summary of technical analysis
| Position | Buy |
| Buy stop | Above 0,733 |
| Stop loss | Below 0,673 |
Explore our
Trading Conditions
- Spreads from 0.0 pip
- 30,000+ Trading Instruments
- Stop Out Level - Only 10%
Ready to Trade?
Open Account Note:
This overview has an informative and tutorial character and is published for free. All the data, included in the overview, are received from public sources, recognized as more or less reliable. Moreover, there is no guarantee that the indicated information is full and precise. Overviews are not updated. The whole information in each overview, including opinion, indicators, charts and anything else, is provided only for familiarization purposes and is not financial advice or а recommendation. The whole text and its any part, as well as the charts cannot be considered as an offer to make a deal with any asset. IFC Markets and its employees under any circumstances are not liable for any action taken by someone else during or after reading the overview.
