- Analytics
- Technical Analysis
NZD USD Technical Analysis - NZD USD Trading: 2017-01-12
New Zealand and EU are planning to organize free-trade zone
New Zealand and European Union are planning to launch as quickly as possible the negotiations to sign a free trade agreement. EU ranks 3rd among major trade partners of New Zealand. Their trade volume totaled $8.6bn in 2015. Will New Zealand dollar advance?
Preparations for trade agreement may take 2-3 years. Additional factor to push New Zealand dollar up may be the substantial increase of Australian currency amid positive economic data. The economies of these two neighbouring countries are strongly connected. Official data on New Zealand will start coming out in the end of this week. ANZ bank released its report on New Zealand’s labour market on Wednesday, according to which the number of job advertisements rose in December for 16th month by 1.6% compared to November. For the last year the benchmark rose 18.8% which is the record increase in 5 years. The interest rate of 1.75% set by the Reserve bank of New Zealand is one of the highest in developed countries. The next RBNZ meeting will take place on February 9, 2017. No interest rate cut is expected but it may happen from the 2nd quarter of this year. This prevents New Zealand dollar from active strengthening.
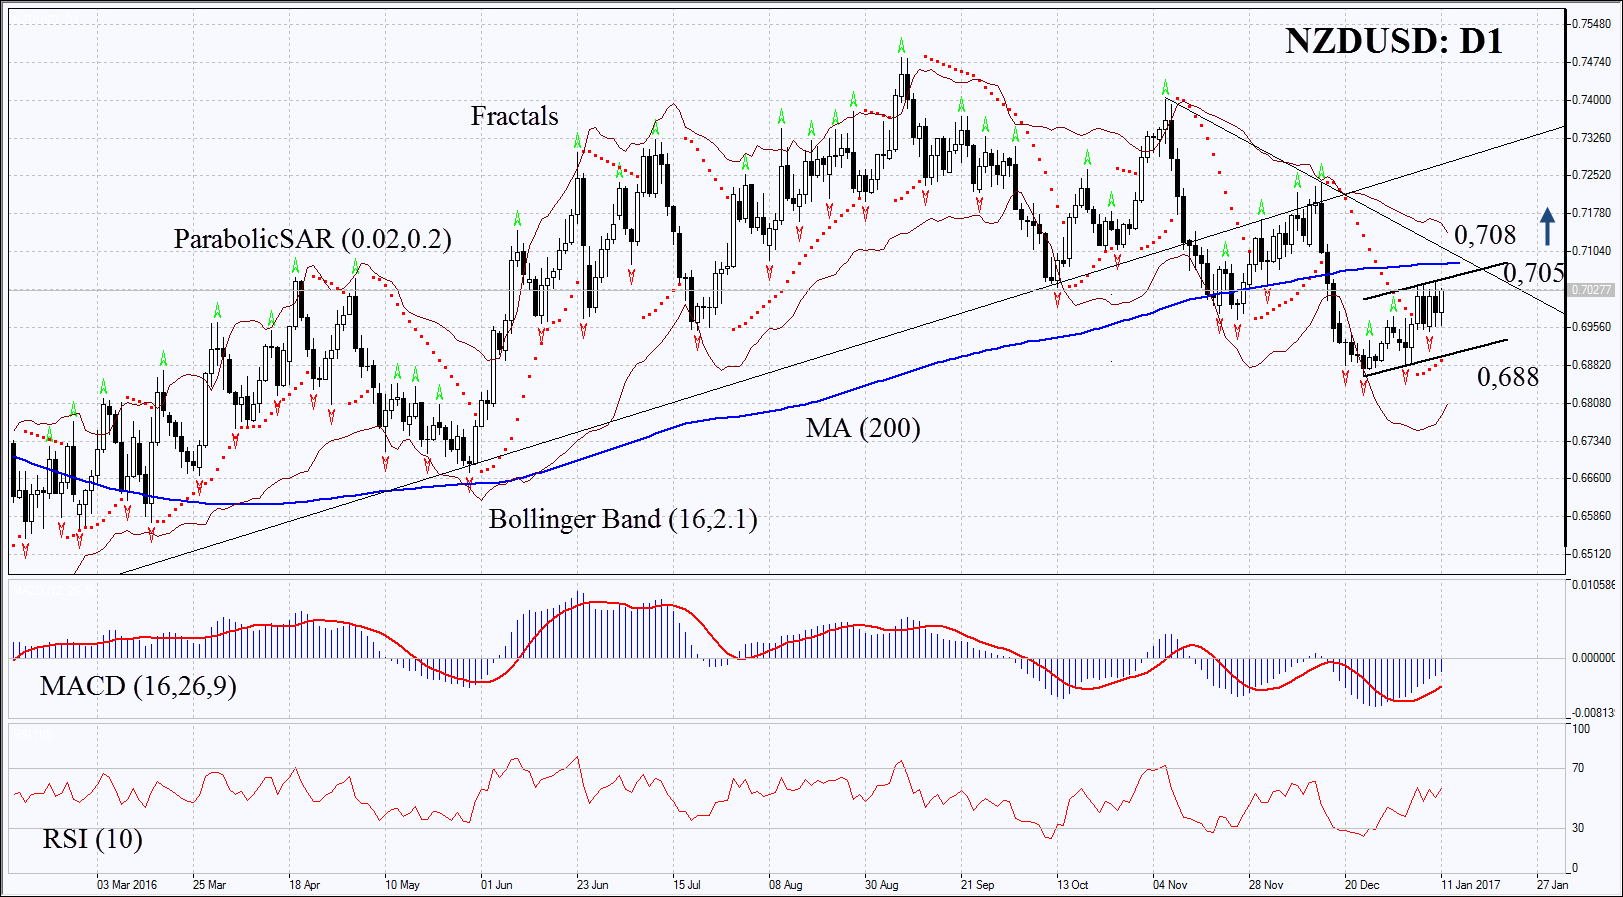
On the daily chart NZDUSD: D1 is correcting up within the downtrend. Further increase is possible in case positive economic data come out in New Zealand and in case high interest rate persists.
- The Parabolic gives bullish signal.
- The Bollinger bands have widened which means higher volatility.
- The RSI is above 50, no divergence.
- The MACD gives bullish signal.
The bullish momentum may develop in case New Zealand dollar surpasses the resistance of the rising channel at 0.705. This level may serve the point of entry. The most risk-averse traders may wait for surpassing the 200-day moving average at 0.708. The initial stop-loss may be placed below the two last fractal lows, the support of the rising trend and the Parabolic signal at 0.688. Having opened the pending order we shall move the stop to the next fractal low following the Parabolic and Bollinger signals. Thus, we are changing the probable profit/loss ratio to the breakeven point. The most risk-averse traders may switch to the 4-hour chart after the trade and place there a stop-loss moving it in the direction of the trade. If the price meets the stop-loss level at 0.688 without reaching the order at 0.705 or 0.708, we recommend cancelling the position: the market sustains internal changes which were not taken into account.
Summary of technical analysis
| Position | Buy |
| Buy stop | above 0.705 or 0.708 |
| Stop loss | below 0.688 |
Explore our
Trading Conditions
- Spreads from 0.0 pip
- 30,000+ Trading Instruments
- Instant Execution
Ready to Trade?
Open Account Note:
This overview has an informative and tutorial character and is published for free. All the data, included in the overview, are received from public sources, recognized as more or less reliable. Moreover, there is no guarantee that the indicated information is full and precise. Overviews are not updated. The whole information in each overview, including opinion, indicators, charts and anything else, is provided only for familiarization purposes and is not financial advice or а recommendation. The whole text and its any part, as well as the charts cannot be considered as an offer to make a deal with any asset. IFC Markets and its employees under any circumstances are not liable for any action taken by someone else during or after reading the overview.
