- Analytics
- Technical Analysis
Soybean Meal Technical Analysis - Soybean Meal Trading: 2019-03-05
The abolition of duties on US soybeans will be discussed at the meeting between the heads of the United States and China
China may abolish duties on US soybeans. Will soybean meal prices rise?
The abolition of duties will be discussed at the meeting between US President Donald Trump and Chinese President Xi Jinping, which is expected on March 27, 2019. If this happens, prices may rise, as China is the world’s largest importer of soybeans. According to the European Commission, soybean imports to the European Union in the 2018/19 agricultural season, from July 1 to March 3, increased by 8% and reached 9.4 million tons. The Brazilian agency INTL FCStone expects a 5% reduction in soybean crop in Brazil in 2019 to 113 million tons.
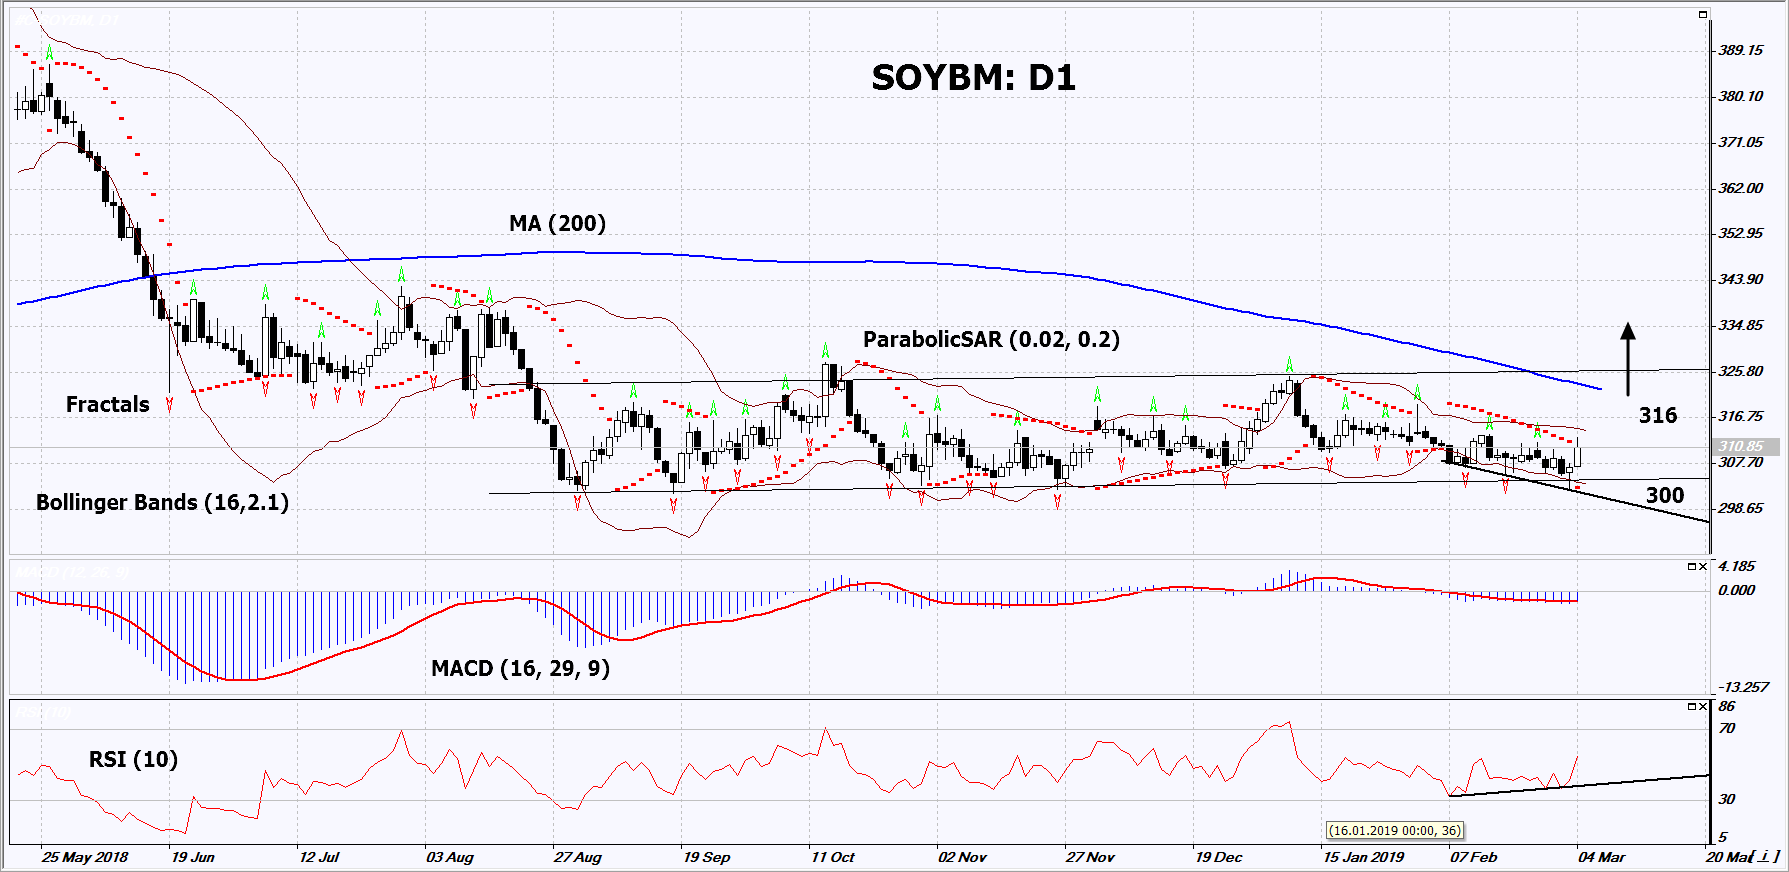
On the daily timeframe, SOYBM: D1 is in a long-term neutral trend. A number of technical analysis indicators formed buy signals. The further price growth is possible in case of an increase in global demand and a reduction in crop.
- The Parabolic Indicator gives a bullish signal.
- The Bollinger bands have narrowed, which indicates low volatility.
- The RSI indicator is above 50. It has formed a positive divergence.
- The MACD indicator gives a bullish signal.
The bullish momentum may develop in case SOYBM exceeds its last fractal high and the upper Bollinger band at 316. This level may serve as an entry point. The initial stop loss may be placed below the low since September 2017, the Parabolic signal and the lower Bollinger band at 300. After opening the pending order, we shall move the stop to the next fractal low following the Bollinger and Parabolic signals. Thus, we are changing the potential profit/loss to the breakeven point. More risk-averse traders may switch to the 4-hour chart after the trade and place there a stop loss moving it in the direction of the trade. If the price meets the stop level (300) without reaching the order (316), we recommend to close the position: the market sustains internal changes that were not taken into account.
Summary of technical analysis
| Position | Buy |
| Buy stop | Above 316 |
| Stop loss | Below 300 |
Explore our
Trading Conditions
- Spreads from 0.0 pip
- 30,000+ Trading Instruments
- Stop Out Level - Only 10%
Ready to Trade?
Open Account Note:
This overview has an informative and tutorial character and is published for free. All the data, included in the overview, are received from public sources, recognized as more or less reliable. Moreover, there is no guarantee that the indicated information is full and precise. Overviews are not updated. The whole information in each overview, including opinion, indicators, charts and anything else, is provided only for familiarization purposes and is not financial advice or а recommendation. The whole text and its any part, as well as the charts cannot be considered as an offer to make a deal with any asset. IFC Markets and its employees under any circumstances are not liable for any action taken by someone else during or after reading the overview.
