- Analytics
- Technical Analysis
USD CAD Technical Analysis - USD CAD Trading: 2019-07-24
Weak macroeconomic data was released in Canada
Weak macroeconomic data had a negative effect on Canadian dollar rate. Will the correction of its quotations continue?
On the USDCAD chart, the weakening of the Canadian dollar looks like a growth in quotations. Wholesale trade in Canada declined by 1.8% in May after a continuous increase over the previous 5 months. The ratio of wholesale stocks to sales (inventory-to-sales) has peaked since 1995. Canadian retail trade also unexpectedly declined in May by 0.1%, while the forecast was + 0.3%. All this may be a sign of a slowdown in the Canadian economy and encourage the Bank of Canada to lower the rate this year. Now it is 1.75% and has been at this level since October 2018. On July 31, 2019, GDP data for May are released in Canada, and on August 2, the trade balance for June. It can affect the dynamics of the Canadian dollar. The next meeting of the Bank of Canada will not take place soon - on September 4.
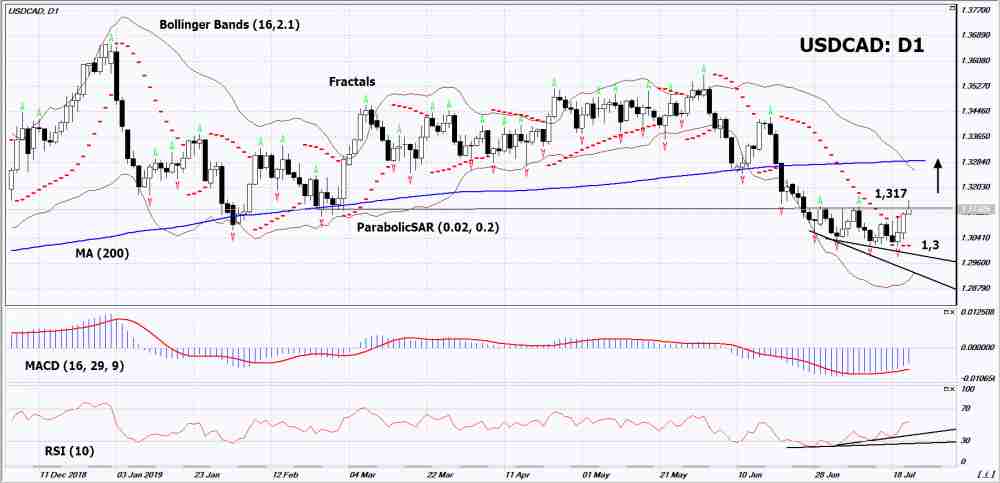
On the daily timeframe USDCAD: D1 is in a neutral trend. Various technical analysis indicators have generated uptrend signals. Correction to the top and further growth of quotations is possible in case of a decrease in the rate of the Central Bank of Canada.
- The Parabolic indicator shows a signal to increase.
- The Bolinger bands is narrowing indicating volatility decrease.
- The RSI indicator is above the 50 mark. It has formed a divergence to increase.
- The MACD indicator gives a bullish signal.
The bullish momentum may develop if USDCAD exceeds its last maximum: 1,317. This level can be used as an entry point. The initial stop lose may be placed below the two last lower fractals and the Parabolic signal: 1.3. After the opening the pending order, stop shall be moves following the signals of Bollinger and Parabolic to the next fractal minimum. Thus, we are changing the potential profit/loss to the breakeven point. More risk-averse traders may switch to the 4-hour chart after the trade and place a stop loss moving it in the direction of the trade. If the price meets the stop level (1,3) without reaching the order (1,317), we recommend to cancel the order: the market sustains internal changes that were not taken into account.
Technical Analysis Summary
| Position | Buy |
| Buy stop | Above 1,317 |
| Stop loss | Below 1,3 |
Explore our
Trading Conditions
- Spreads from 0.0 pip
- 30,000+ Trading Instruments
- Stop Out Level - Only 10%
Ready to Trade?
Open Account Note:
This overview has an informative and tutorial character and is published for free. All the data, included in the overview, are received from public sources, recognized as more or less reliable. Moreover, there is no guarantee that the indicated information is full and precise. Overviews are not updated. The whole information in each overview, including opinion, indicators, charts and anything else, is provided only for familiarization purposes and is not financial advice or а recommendation. The whole text and its any part, as well as the charts cannot be considered as an offer to make a deal with any asset. IFC Markets and its employees under any circumstances are not liable for any action taken by someone else during or after reading the overview.
