- Analytics
- Technical Analysis
WHEAT Technical Analysis - WHEAT Trading: 2019-09-30
Getting ready to publication of USDA review
Getting ready for the publication of the U.S. Grain Review Department of Agriculture (USDA). Will the wheat quotations grow?
The data will be released on Monday, September 30, 2019 at 16-00 GMT. According to a consensus forecast of analysts, in a USDA survey, US wheat inventories will amount to 2.318 billion bushels, which is 3% lower than last year. USDA is expected to estimate production of American wheat in the 2019/20 agricultural season at 1.968 billion bushels. This is 0.6% less than the August forecast. This fall, wheat harvesting may be delayed due to rainy weather in western Canada and the United States. Grain prices on the Euronext European Exchange reached a 6-week maximum level due to the active purchases by countries such as Egypt and Saudi Arabia amid a weak euro. Australia previously cut its wheat crop forecast by 10% due to drought.
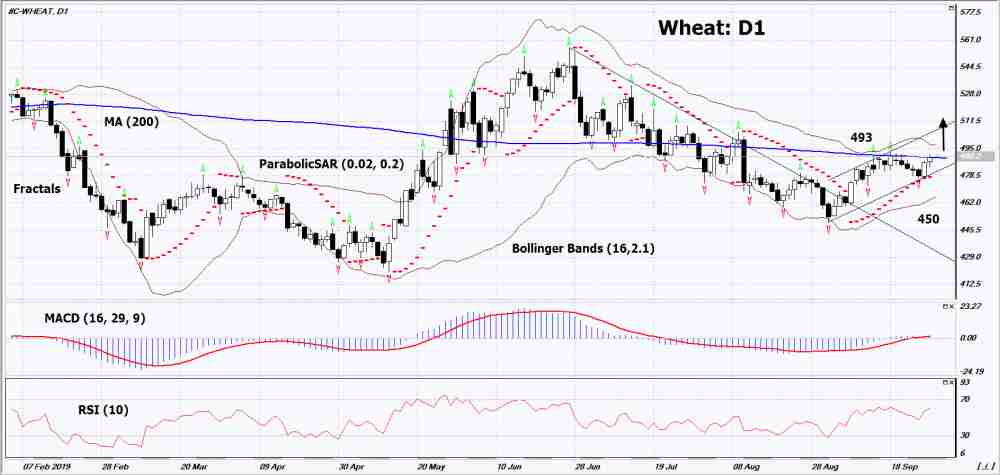
On the daily timeframe Wheat: D1 is in uptrend. Various technical analysis indicators have generated signals to increase. Further growth of quotations is possible in case of an increase in global demand amid a decline in inventories of producing countries.
- The Parabolic indicator demonstrates a signal to increase.
- The Bolinger bands narrowed, indicating low volatility. Both Bollinger Lines Slope Up.
- The RSI indicator is above the mark of 50. No divergence observed.
- MACD indicator gives a bullish signal.
The bullish momentum may develop if Wheat exceeds its last upper fractal and 200-day moving average line: 493. This level can be used as an entry point. The initial stop lose may be placed below the last 3 lower fractals, the Parabolic signal and the lower Bollinger line: 450. After opening the pending order, the stop shall be moved following the Bollinger and Parabolic signals to the next fractal minimum. Thus, we are changing the potential profit/loss to the breakeven point. More risk-averse traders may switch to the 4-hour chart after the trade and place a stop loss moving it in the direction of the trade. If the price meets the stop level (450) without reaching the order (493), we recommend to cancel the order: the market sustains internal changes that were not taken into account.
Technical Analysis Summary
| Position | Buy |
| Buy stop | Above 493 |
| Stop loss | Below 450 |
Explore our
Trading Conditions
- Spreads from 0.0 pip
- 30,000+ Trading Instruments
- Stop Out Level - Only 10%
Ready to Trade?
Open Account Note:
This overview has an informative and tutorial character and is published for free. All the data, included in the overview, are received from public sources, recognized as more or less reliable. Moreover, there is no guarantee that the indicated information is full and precise. Overviews are not updated. The whole information in each overview, including opinion, indicators, charts and anything else, is provided only for familiarization purposes and is not financial advice or а recommendation. The whole text and its any part, as well as the charts cannot be considered as an offer to make a deal with any asset. IFC Markets and its employees under any circumstances are not liable for any action taken by someone else during or after reading the overview.
