- Analytics
- Technical Analysis
Gold Technical Analysis - Gold Trading: 2019-10-02
China-US trade negotiations could reduce global risks
In this analysis, we will consider the gold versus euro trading instrument from the Precious Metals group. Will the XAUEUR quotations fall?
Such movement is observed when gold becomes cheaper, and a single European currency strengthens. The price of precious metals may decrease if the trade negotiations between China and the US begin next week, as well as in the case of the Brexit agreement between Britain and the EU. All this reduces global risks. In addition, gold quotes often decline in case of strengthening of the American currency, as investors see it as an alternative to the dollar. A positive factor for the dollar and a negative factor for precious metals may be the preservation of the current Fed rate at 2% at the end of the next meeting on October 30, 2019. Inflation in the USA is already noticeably higher and amounts to 2.4% in annual terms. The probability of a rate cut is now estimated by CME FedWatch at 62.5%. This week for XAUEUR significant macroeconomic data will be released on Friday, October 4 - Non-farm Payrolls (employment in the US non-farm sector) for September. The dynamics of the euro is likely to depend on the outcome of the ECB meeting on October 24. Like the US Federal Reserve, the European regulator may postpone easing its monetary policy.
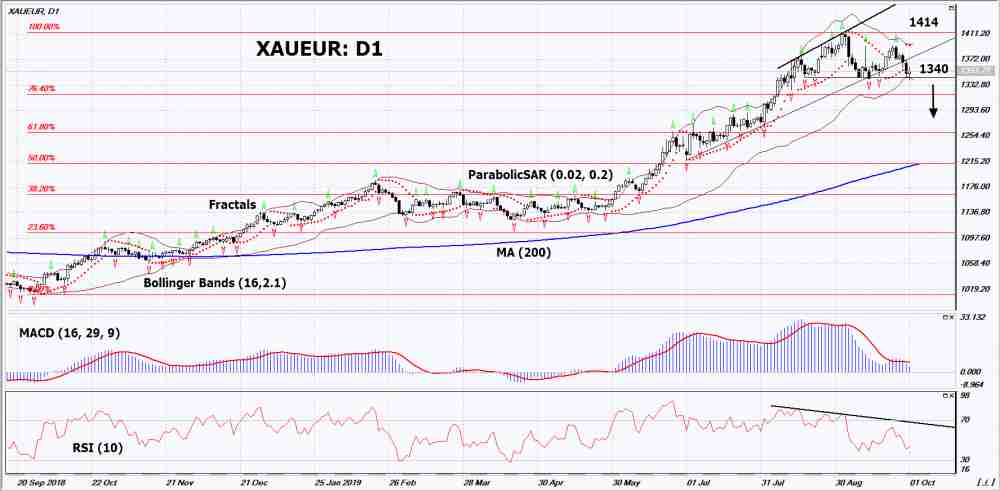
On the daily timeframe XAUEUR: D1 broke down the support line of the uptrend. Various technical analysis indicators formed signals to decrease. It is possible in case of euro rate strengthening and precious metals demand decrease.
- The Parabolic indicator gives a bearish signal.
- The Bolinger bands narrowed, indicating a volatility decrease. Both Bollinger Lines Slope Down.
- The RSI indicator is below the mark of 50. It has formed a divergence to decrease.
- The MACD indicator demonstrates a downward signal.
The bearish momentum may develop if XAUEUR falls below the last two lower fractals and the lower Bollinger line: 1340. This level can be used as an entry point. The initial stop lose may be placed higher than the last three upper fractals, the historical maximum, the upper Bollinger line and the Parabolic signal: 1414. After opening a pending order, the stop shall be moved following the Bollinger and Parabolic signals to the next fractal minimum. Thus, we change the potential profit / loss ratio in our favor. Thus, we are changing the potential profit/loss to the breakeven point. More risk-averse traders may switch to the 4-hour chart after the trade and place a stop loss moving it in the direction of the trade. If the price meets the stop level (1414) without reaching the order (1340), we recommend to cancel the order: the market sustains internal changes that were not taken into account.
Technical Analysis Summary
| Position | Sell |
| Sell stop | Below 1340 |
| Stop loss | Above 1414 |
Explore our
Trading Conditions
- Spreads from 0.0 pip
- 30,000+ Trading Instruments
- Stop Out Level - Only 10%
Ready to Trade?
Open Account Note:
This overview has an informative and tutorial character and is published for free. All the data, included in the overview, are received from public sources, recognized as more or less reliable. Moreover, there is no guarantee that the indicated information is full and precise. Overviews are not updated. The whole information in each overview, including opinion, indicators, charts and anything else, is provided only for familiarization purposes and is not financial advice or а recommendation. The whole text and its any part, as well as the charts cannot be considered as an offer to make a deal with any asset. IFC Markets and its employees under any circumstances are not liable for any action taken by someone else during or after reading the overview.
