- Analytics
- Technical Analysis
Gold vs SP500 Technical Analysis - Gold vs SP500 Trading: 2018-08-13
S&P 500 shows a tendency to decrease
In this review, we suggest considering the composite gold instrument - Gold vs S&P 500 index. Will XAUSnP prices rise? Such a movement is observed when gold prices rise, and the S&P 500 decreases.
Gold is in demand despite the strong increase in the US dollar index. As a rule, they move in opposite phase. However, now both gold and the US dollar are in demand amid a strong decline in exchange rates of currencies of practically all developing countries. World economic risks increased significantly because of the collapse of the Turkish lira to the historic low (in its chart it looks like an increase). On Friday, during a day, the lira fell by more than 20%, but later regained a part of losses. This happened amid an increase in US import duties on steel - an important part of Turkish exports. Let us note that the trade balance and the current account balance of Turkey have already been stably negative for a long time. An additional factor for the growth of gold prices may be the massive closure of net short positions. On the Comex exchange, their volume has previously reached a historic high. In turn, the decrease in the S&P 500 stock index can also contribute to the economic crisis in Turkey. In many respects, it was caused by the US tariff restrictions. Investors fear that they can complicate the whole world trade and cause retaliatory measures of a number of countries against US goods. Because of this, stocks of the US banks JPMorgan, Wells Fargo and Bank of America, as well as companies, which strongly depend on exports of Boeing, 3M and Caterpillar, fell noticeably on Friday.
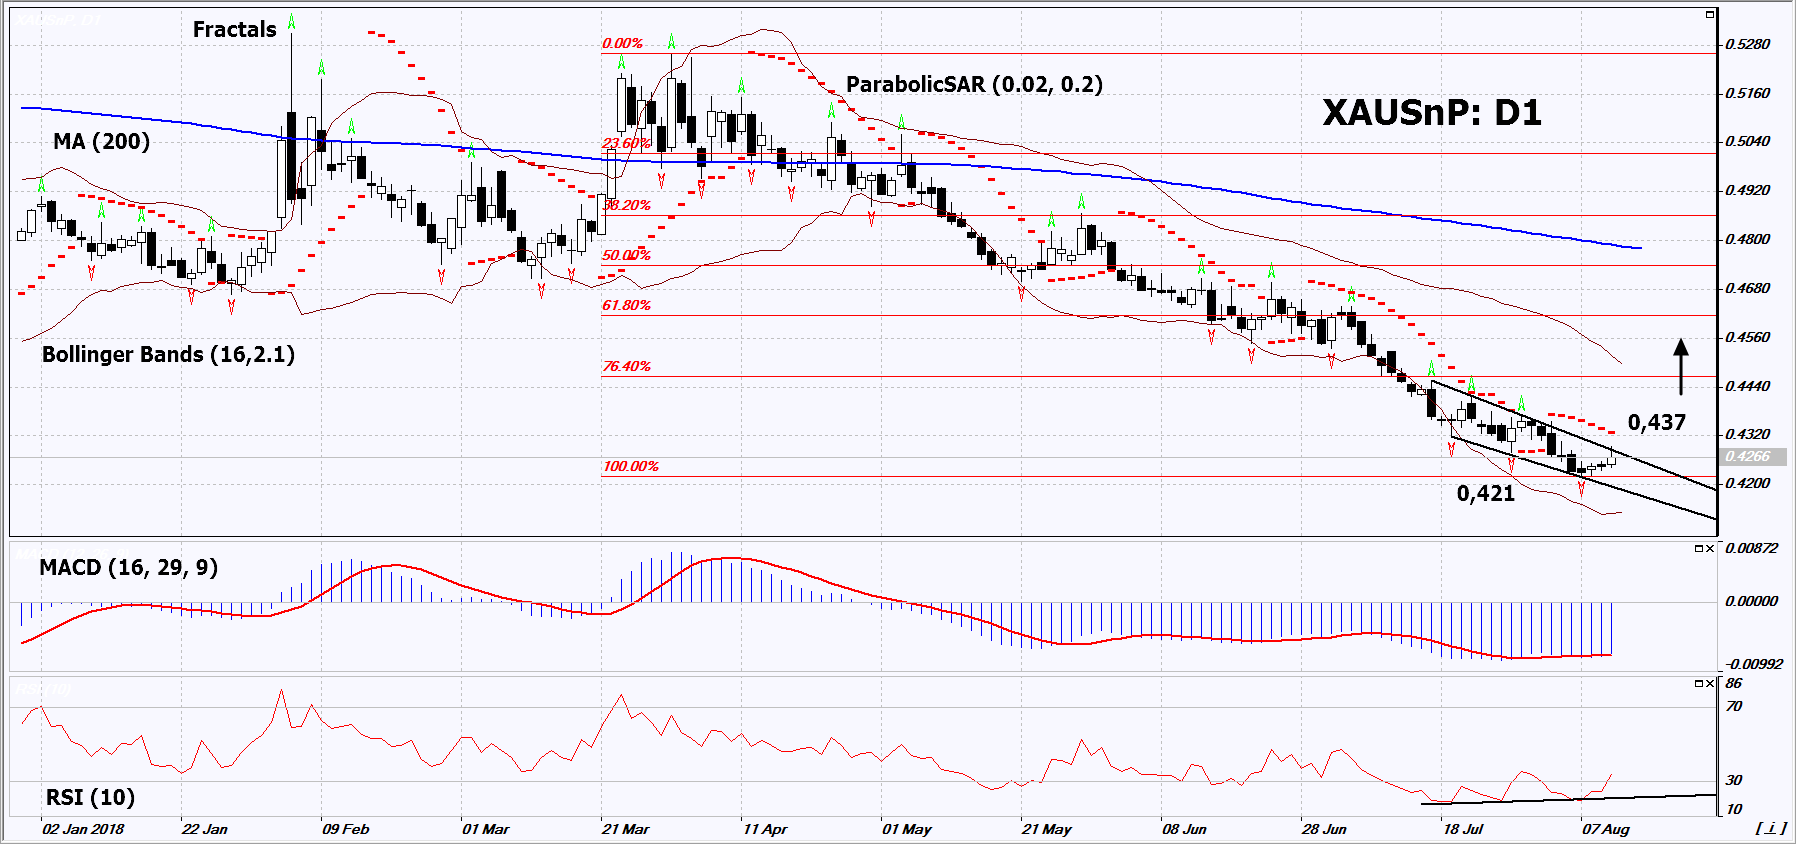
On the daily timeframe, XAUSnP: D1 approached the resistance line of the long-term downward range within the framework of the correction from the 11-year low. The resistance must be breached up before opening a buy position. A number of technical analysis indicators formed buy signals. The further price increase is possible in case of an increase in the world demand for precious metals and negative economic and corporate data in the US.
- The Parabolic indicator gives a bearish signal. It can be used as an additional resistance, which must be overcome before opening a buy position.
- The Bollinger bands have widened, which indicates high volatility. The lower band is titled upward.
- The RSI indicator is below 50. It has formed a positive divergence.
- The MACD indicator gives a bullish signal.
The bullish momentum may develop in case XAUSnP exceeds its last fractal high and the Parabolic signal at 0.437. ЭThis level may serve as an entry point. The initial stop loss may be placed below the last fractal low and the 11-year low at 0.421. After opening the pending order, we shall move the stop to the next fractal low following the Bollinger and Parabolic signals. Thus, we are changing the potential profit/loss to the breakeven point. More risk-averse traders may switch to the 4-hour chart after the trade and place there a stop loss moving it in the direction of the trade. If the price meets the stop level (0.421) without reaching the order (0.437), we recommend to close the position: the market sustains internal changes that were not taken into account.
Summary of technical analysis
| Position | Buy |
| Buy stop | Above 0.437 |
| Stop loss | Below 0.421 |
Explore our
Trading Conditions
- Spreads from 0.0 pip
- 30,000+ Trading Instruments
- Stop Out Level - Only 10%
Ready to Trade?
Open Account Note:
This overview has an informative and tutorial character and is published for free. All the data, included in the overview, are received from public sources, recognized as more or less reliable. Moreover, there is no guarantee that the indicated information is full and precise. Overviews are not updated. The whole information in each overview, including opinion, indicators, charts and anything else, is provided only for familiarization purposes and is not financial advice or а recommendation. The whole text and its any part, as well as the charts cannot be considered as an offer to make a deal with any asset. IFC Markets and its employees under any circumstances are not liable for any action taken by someone else during or after reading the overview.
