- Analytics
- Technical Analysis
Gold vs SP500 Technical Analysis - Gold vs SP500 Trading: 2020-01-06
Political risks in the Middle East may cause an increase in gold prices
In this review, we suggest considering the personal composite gold instrument - Gold vs S&P 500 Index. Will the XAUSnP rise? Such a movement is observed when gold prices rise, and the S&P 500 decreases.
Gold is a safe-haven asset. Its prices rise in case of an increase in political risks. Gold prices rose on Friday due to reports of the death of Iranian General Qassem Soleimani in Iraq after the use of an American rocket. Investors fear increasing tensions in the Middle East. The US stock index S&P 500 decreased. In addition to problems in the Middle East, this was contributed by an unexpected decrease in the ISM Manufacturing economic indicator in December.
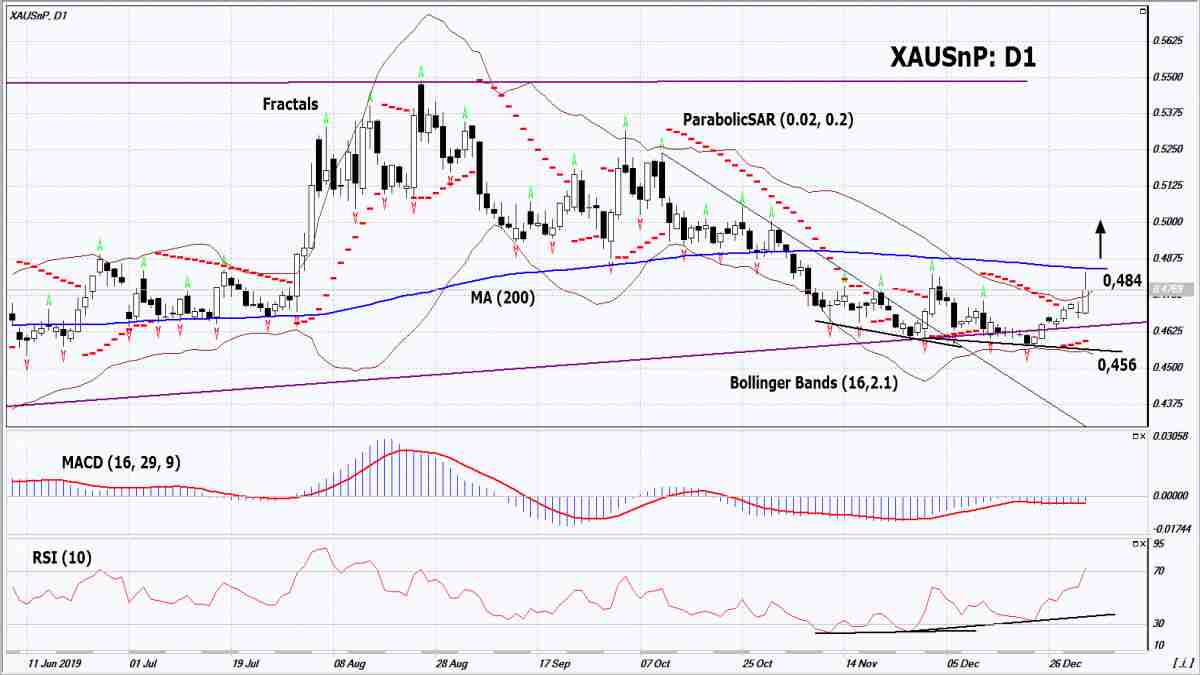
On the daily timeframe, the XAUSnP: D1 is correcting up from the lower boundary of the long-term uptrend. It is the lower boundary of a large triangle. A number of technical analysis indicators formed buy signals. The further price increase is possible in case of the aggravation of the situation in the Middle East.
- The Parabolic indicator gives a bullish signal.
- The Bollinger bands have widened, which indicates high volatility. The upper Bollinger band is titled upward.
- The RSI indicator is above 50. It has formed a positive divergence.
- The MACD indicator gives a bullish signal.
The bullish momentum may develop in case XAUSnP exceeds the превысит 200-day moving average line at 0.484. This level may serve as an entry point. The initial stop loss may be placed below the boundary of the triangle, the fractal low, the lower Bollinger band and the Parabolic signal at 0.456. After opening the pending order, we shall move the stop to the next fractal low following the Bollinger and Parabolic signals. Thus, we are changing the potential profit/loss to the breakeven point. More risk-averse traders may switch to the 4-hour chart after the trade and place there a stop loss moving it in the direction of the trade. If the price meets the stop level (0.456) without reaching the order (0.484), we recommend cancelling the position: the market sustains internal changes that were not taken into account.
Summary of technical analysis
| Position | Buy |
| Buy stop | Above 0.484 |
| Stop loss | Below 0.456 |
Explore our
Trading Conditions
- Spreads from 0.0 pip
- 30,000+ Trading Instruments
- Stop Out Level - Only 10%
Ready to Trade?
Open Account Note:
This overview has an informative and tutorial character and is published for free. All the data, included in the overview, are received from public sources, recognized as more or less reliable. Moreover, there is no guarantee that the indicated information is full and precise. Overviews are not updated. The whole information in each overview, including opinion, indicators, charts and anything else, is provided only for familiarization purposes and is not financial advice or а recommendation. The whole text and its any part, as well as the charts cannot be considered as an offer to make a deal with any asset. IFC Markets and its employees under any circumstances are not liable for any action taken by someone else during or after reading the overview.
