- Analytics
- Technical Analysis
Gold Technical Analysis - Gold Trading: 2014-11-13
Gold market equilibrium
Here we consider the XAUUSD (Gold) futures contract on the H4 price chart. The price was moving in the daily retracement before an unsteady balance of bears and bulls was formed (see the triangle on the chart). The last candlestick breached the H4 trend line downwards. However, there was no confirmatory signal on the part of the RSI-Bars oscillator.
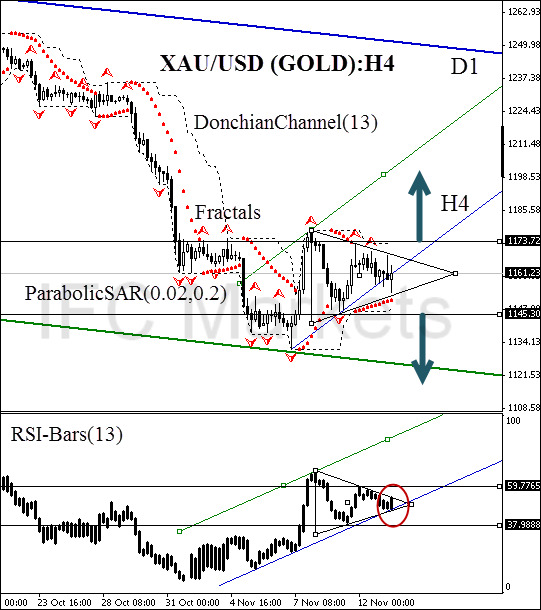
After position opening, Stop Loss is to be moved after the ParabolicSAR values, near the next fractal high (short position) or fractal low (long position). Thus, we are changing the probable profit/loss ratio to the breakeven point.
| Position | Sell |
| Sell stop | below 1145.30 |
| Stop loss | above 1173.72 |
| Position | Buy |
| Buy stop | above 1173.72 |
| Stop loss | below 1145.30 |
- Get Certificate

Note:
This overview has an informative and tutorial character and is published for free. All the data, included in the overview, are received from public sources, recognized as more or less reliable. Moreover, there is no guarantee that the indicated information is full and precise. Overviews are not updated. The whole information in each overview, including opinion, indicators, charts and anything else, is provided only for familiarization purposes and is not financial advice or а recommendation. The whole text and its any part, as well as the charts cannot be considered as an offer to make a deal with any asset. IFC Markets and its employees under any circumstances are not liable for any action taken by someone else during or after reading the overview.
