- Analytics
- Technical Analysis
COPPER Technical Analysis - COPPER Trading: 2017-05-29
Strike at a large mine
The mining company Freeport McMoRan reported a strike at its copper mine Grasberg in Indonesia. Will the copper prices grow?
The Grasberg is the third copper producer in the world. The suspension of its work may cause a copper deficit in the world market. An additional factor for the price increase may be the decline in trade inventories on the Shanghai Stock Exchange in China. Copper premiums rose from the minimum annual level of $10 to $75 - the highest level since March of this year. Besides, according to the Japan Copper and Brass Association data, the production of rolled copper in Japan increased by 6.9% in April compared to the same period of the previous year, amounting to 67.65 thousand tons. In March the production dropped by 2.5%. Let us recall that due to the holidays in the US, China and the UK, local commodity exchanges will be closed on Monday.
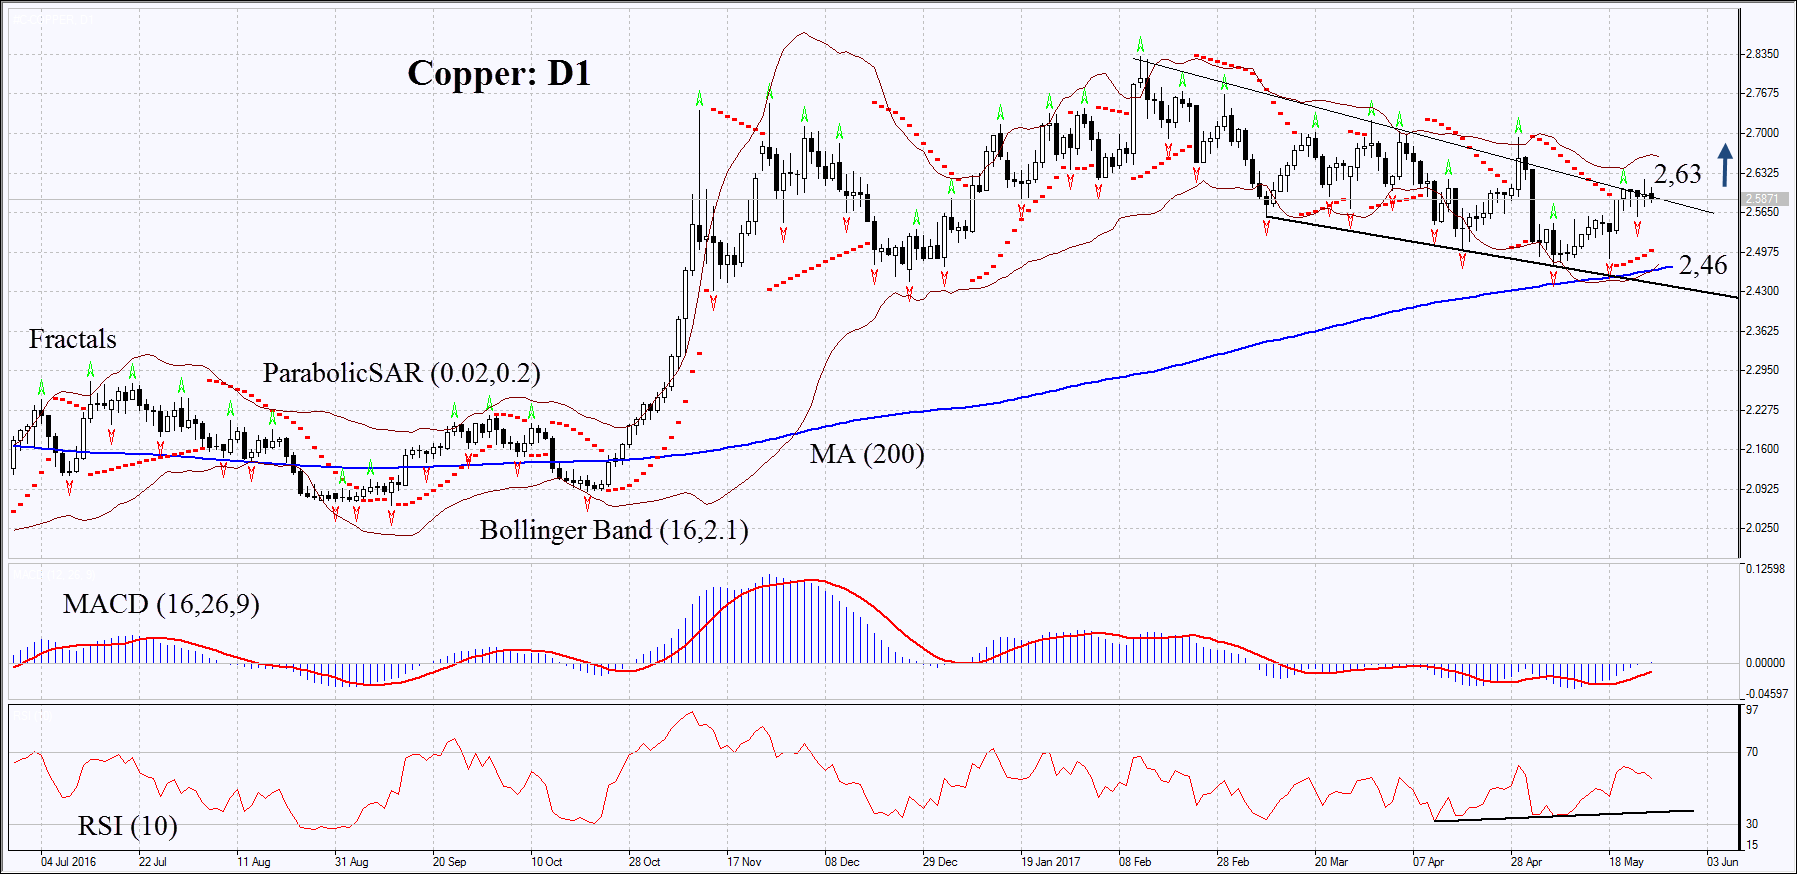
On the daily timeframe, Copper: D1 is near the resistance line of the descending channel. To open a Buy position, it has to be primarily breached up. The further price increase is possible in case of the production cuts and higher global demand.
- The Parabolic indicator gives a bullish signal.
- The Bollinger bands indicate ordinary volatility and are tilted upwards.
- The RSI is below 50. It has formed a positive divergence.
- The MACD gives a bullish signal.
The bullish momentum may develop in case Copper exceeds the previous high at 2.63. This level may serve as the entry point. The initial stop loss may be placed below the 2 last fractal lows, the 200-day moving average, the Parabolic signal and the lower Bollinger band at 2.46. After opening the pending order, we shall move the stop to the next fractal low following the Bollinger and Parabolic signals. Thus, we are changing the potential profit/loss to the breakeven point. More risk-averse traders may switch to the 4-hour chart after the trade and place there a stop loss moving it in the direction of the trade. If the price meets the stop level at 2.46 without reaching the order at 2.63 we recommend to close the position: the market sustains internal changes that were not taken into account.
Summary of technical analysis
| Position | Buy |
| Buy stop | above 2,63 |
| Stop loss | below 2,46 |
Explore our
Trading Conditions
- Spreads from 0.0 pip
- 30,000+ Trading Instruments
- Stop Out Level - Only 10%
Ready to Trade?
Open Account Note:
This overview has an informative and tutorial character and is published for free. All the data, included in the overview, are received from public sources, recognized as more or less reliable. Moreover, there is no guarantee that the indicated information is full and precise. Overviews are not updated. The whole information in each overview, including opinion, indicators, charts and anything else, is provided only for familiarization purposes and is not financial advice or а recommendation. The whole text and its any part, as well as the charts cannot be considered as an offer to make a deal with any asset. IFC Markets and its employees under any circumstances are not liable for any action taken by someone else during or after reading the overview.
