- Analytics
- Technical Analysis
CORN Technical Analysis - CORN Trading: 2018-01-26
The drought in Argentina may reduce the corn crop
The USDA’s Foreign Agricultural Services office in Argentina revised down the forecast for corn crop in Argentina because of the drought in the 2017/18 agricultural season. Will its quotes grow?
The local USDA office expects the production of corn to be by 2 mln tonnes less than the official forecast and to amount to 40 mln tonnes. Argentina, alongside with the US and Brazil, is the world's largest corn exporter. Additional factors in the price growth may be the strong weakening of the US dollar, as well as an increase in the imports of sweet corn to the European Union. From the beginning of 2017/18 season to 23 January, 2018, the EU imports increased to 9.3 mln tonnes, compared with 6 mln in the previous season. U.S. Energy Information Administration reported an increase in the US biofuel reserves by 1.06 mln barrels per week to the record level of 23.8 mln. This may increase the demand for corn as one of the main elements of biofuel.
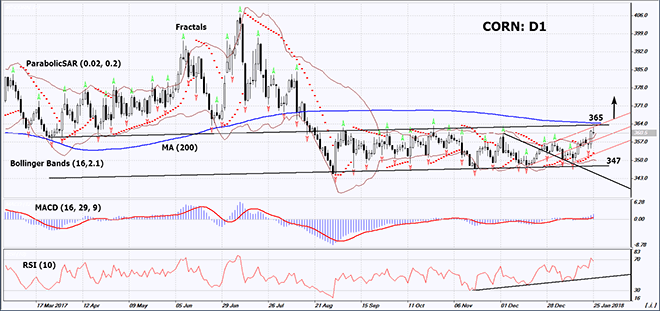
On the daily timeframe, CORN: D1 approached the upper boundary of the neutral trend and the 200-day moving average line. They need to breach up in order to open a Buy position. The further price increase in possible in case of the worsening of the weather in Argentina and an increase in the world demand.
- The Parabolic indicator gives a bullish signal.
- The Bollinger bands have widened, which means higher volatility.
- The RSI indicator is above 50. It has formed a positive divergence.
- The MACD indicator gives a bullish signal.
The bullish momentum may develop in case CORN exceeds the upper boundary of the neutral trend and the 200-day moving average line at 365. This level may serve as an entry point. The initial stop loss may be placed below the Parabolic signal and the last fractal low, the lower Bollinger band and the lower boundary of the neutral trend at 347. After opening the pending order, we shall move the stop to the next fractal low following the Bollinger and Parabolic signals. Thus, we are changing the potential profit/loss to the breakeven point. More risk-averse traders may switch to the 4-hour chart after the trade and place there a stop loss moving it in the direction of the trade. If the price meets the stop level at 347 without reaching the order at 365, we recommend cancelling the position: the market sustains internal changes that were not taken into account.
Summary of technical analysis
| Position | Buy |
| Buy stop | above 365 |
| Stop loss | below 347 |
- Get Certificate

Note:
This overview has an informative and tutorial character and is published for free. All the data, included in the overview, are received from public sources, recognized as more or less reliable. Moreover, there is no guarantee that the indicated information is full and precise. Overviews are not updated. The whole information in each overview, including opinion, indicators, charts and anything else, is provided only for familiarization purposes and is not financial advice or а recommendation. The whole text and its any part, as well as the charts cannot be considered as an offer to make a deal with any asset. IFC Markets and its employees under any circumstances are not liable for any action taken by someone else during or after reading the overview.
