- Analytics
- Technical Analysis
CORN Technical Analysis - CORN Trading: 2018-06-20
Lower expected Chinese import bearish for corn prices
Lower Chinese imports after the country imposed retaliatory tariffs on US goods imports is bearish for corn. Will corn prices continue the decline?
The US Department of Agriculture's WASDE report last week was bullish for corn: the USDA lowered its beginning and ending stocks estimates due to stronger corn export demand and ethanol usage. However with no adverse weather forecasts for US Corn Belt to provide additional support, corn prices were falling after China imposed retaliatory tariffs on US goods, including corn, following the announcement of US tariffs Friday. China’s corn imports from the US hit 757,000 tons last year totaling $160 million, up almost 240%. China’s purchases of US corn will fall If China doesn’t revoke its tariffs after President Trump threatened 10% tariffs on additional $200 billion Chinese imports in case China doesn’t renounce its $50 billion retaliatory tariffs on US imports. Lower export demand is bearish for corn.
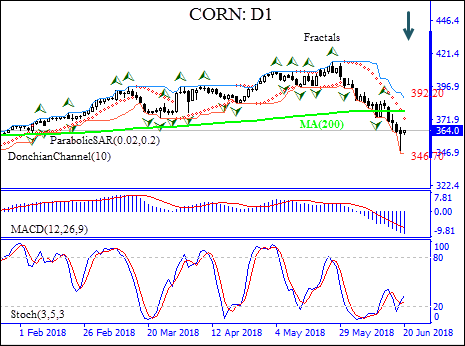
On the daily timeframe the CORN: D1 has been trading with negative bias after hitting two-year high in mid-May. It has fallen below the 200-day moving average MA(200) which is leveling off.
- The Donchian channel indicates downtrend: it is tilted lower.
- The Parabolic indicator has formed a sell signal.
- The MACD indicator is below the signal line and the gap is widening, which is bearish.
- The stochastic oscillator is rising from the oversold zone, this is a bullish signal.
We believe the bearish momentum will continue after the price breaches below the lower boundary of Donchian channel at 346.70. This level can be used as an entry point for placing a pending order to sell. The stop loss can be placed above last fractal high at 392.20. After placing the order, the stop loss is to be moved every day to the next fractal high, following Parabolic signals. Thus, we are changing the probable profit/loss ratio to the breakeven point. If the price meets the stop loss level (392.20) without reaching the order (346.70), we recommend cancelling the order: the market has undergone internal changes which were not taken into account.
Technical Analysis Summary
| Position | Sell |
| Sell stop | Below 346.70 |
| Stop loss | Above 392.20 |
Explore our
Trading Conditions
- Spreads from 0.0 pip
- 30,000+ Trading Instruments
- Stop Out Level - Only 10%
Ready to Trade?
Open Account Note:
This overview has an informative and tutorial character and is published for free. All the data, included in the overview, are received from public sources, recognized as more or less reliable. Moreover, there is no guarantee that the indicated information is full and precise. Overviews are not updated. The whole information in each overview, including opinion, indicators, charts and anything else, is provided only for familiarization purposes and is not financial advice or а recommendation. The whole text and its any part, as well as the charts cannot be considered as an offer to make a deal with any asset. IFC Markets and its employees under any circumstances are not liable for any action taken by someone else during or after reading the overview.
