- Analytics
- Technical Analysis
GB 100 Index Technical Analysis - GB 100 Index Trading: 2019-03-29
Technical setup bullish for GB100
Slowing mortgage and sales data followed preceding report of better than forecast retail sales in February. Will the GB100 advance continue?
UK economic data have been mixed recently: retail sales growth in the UK was little changed in February, ticking to 4% over year from 4.1% in January. The expectations were retail sales growth would slow to 3.3%. Reports a week later indicated mortgage approvals in February and realized sales in March declined more than forecast. However the technical setting indicates upside momentum for UK stock market. At the same time a couple days ago the British parliament voted on eight different Brexit alternatives Wednesday but none received the majority support, increasing the likelihood of a hard Brexit. The economic and political uncertainty of the terms of UK’s departure from the European Union remains an unresolved downside risk for UK economy.
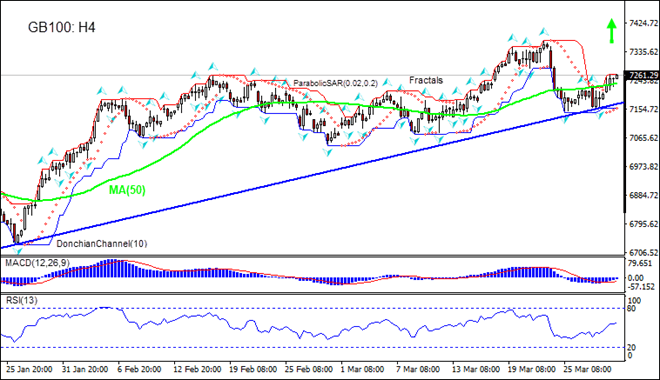
On the daily timeframe GB100: H4 is rising after bouncing off support line. It has breached above the 50-day moving average MA(50). These are bullish developments.
- The Parabolic indicator has formed a buy signal.
- The Donchian channel indicates no trend yet: it is flat.
- The MACD indicator is below the signal line with the gap narrowing. This is a bullish signal.
- The RSI oscillator is rising but has not yet reached the overbought zone.
We believe the bullish momentum will continue after the price breaches above the upper Donchian boundary at 7254.37. This level can be used as an entry point for placing a pending order to buy. The stop loss can be placed below the lower fractal at 7151.73. After placing the pending order the stop loss is to be moved every day to the next fractal low, following Parabolic signals. Thus, we are changing the expected profit/loss ratio to the breakeven point. If the price meets the stop-loss level (7151.73) without reaching the order (7254.37) we recommend cancelling the order: the market sustains internal changes which were not taken into account.
Technical Analysis Summary
| Position | Buy |
| Buy Stop | Above 7254.37 |
| Stop loss | Below 7151.73 |
- Get Certificate

Note:
This overview has an informative and tutorial character and is published for free. All the data, included in the overview, are received from public sources, recognized as more or less reliable. Moreover, there is no guarantee that the indicated information is full and precise. Overviews are not updated. The whole information in each overview, including opinion, indicators, charts and anything else, is provided only for familiarization purposes and is not financial advice or а recommendation. The whole text and its any part, as well as the charts cannot be considered as an offer to make a deal with any asset. IFC Markets and its employees under any circumstances are not liable for any action taken by someone else during or after reading the overview.
