- Analytics
- Technical Analysis
NZD CHF Technical Analysis - NZD CHF Trading: 2019-10-29
Negotiations between the USA and China are successful
In this review, we suggest to consider the currency pair New Zealand dollar against the Swiss franc Will the NZDCHF quotations grow? Such dynamics are observed with the weakening of the Swiss franc and the strengthening of the New Zealand dollar.
The main factor in the decrease in the quotations of the Swiss franc may be a decrease in global risks amid progress in the US-Chinese negotiations. This progress was announced by US President Donald Trump. The first stage of trade agreements between the United States and China can be signed during the Asia-Pacific Economic Cooperation (APEC) summit in Chile on November 16-17, 2019. The Swiss franc, previously regarded as a safe haven currency, may lose some of its appeal. In turn, for the New Zealand dollar, successful trade negotiations are positive sign, since China is New Zealand's most important trading partner. Inflation and the index of business activity in industry (PMI) for October, as well as retail sales for September will be published on November 1st in Switzerland .These data may affect the Swiss franc. On October 31, a review of the economy by the Reserve Bank of New Zealand will be released, which can affect the rate of the New Zealand dollar.
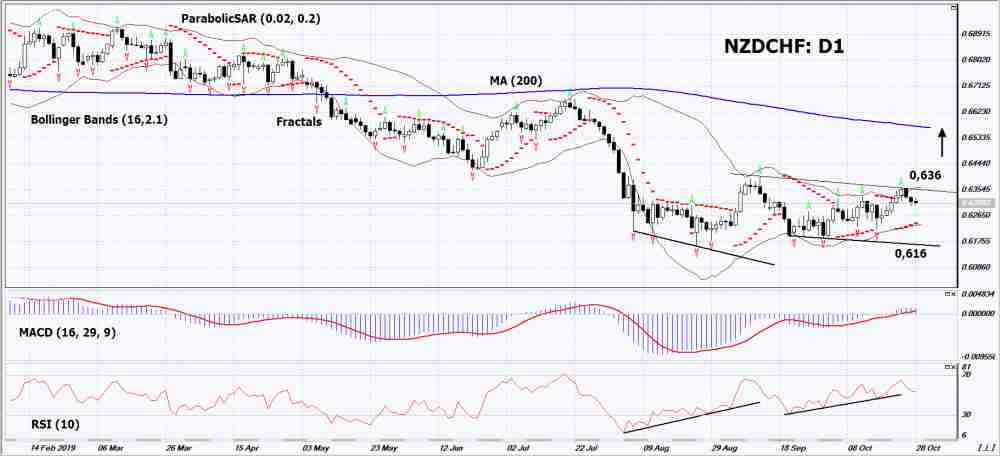
On the daily timeframeNZDCHF: D1 approached the upper limit of the neutral range. Before opening a buy position, it must be broken up. Various technical analysis indicators have generated signals to increase. Further growth of quotations is possible in case of successful trade negotiations between China and the USA and the publication of weak economic data in Switzerland.
- The Parabolic indicator gives a bullish signal.
- The Bolinger bands narrowed, indicating a volatility decrease. Both Bollinger lines are up.
- The RSI indicator is above the mark of 50. It has formed a divergence to increase.
- The MACD indicator demonstrates an uptrend signal.
The bullish momentum may develop if NZDCHF exceeds the last upper fractal and the upper Bollinger line: 0.636. This level can be used as an entry point. Initial stop lose may be placed below the 4-year low, the lower Bollinger line and the Parabolic signal: 0.616. After opening the pending order, the stop shall be moved following the Bollinger and Parabolic signals to the next fractal minimum. Thus, we are changing the potential profit/loss to the breakeven point. More risk-averse traders may switch to the 4-hour chart after the trade and place a stop loss moving it in the direction of the trade. If the price meets the stop level (0,616) without reaching the order (0,636), we recommend to cancel the order: the market sustains internal changes that were not taken into account.
Technical Analysis Summary
| Position | Buy |
| Buy stop | Above 0,636 |
| Stop loss | Below 0,616 |
Explore our
Trading Conditions
- Spreads from 0.0 pip
- 30,000+ Trading Instruments
- Stop Out Level - Only 10%
Ready to Trade?
Open Account Note:
This overview has an informative and tutorial character and is published for free. All the data, included in the overview, are received from public sources, recognized as more or less reliable. Moreover, there is no guarantee that the indicated information is full and precise. Overviews are not updated. The whole information in each overview, including opinion, indicators, charts and anything else, is provided only for familiarization purposes and is not financial advice or а recommendation. The whole text and its any part, as well as the charts cannot be considered as an offer to make a deal with any asset. IFC Markets and its employees under any circumstances are not liable for any action taken by someone else during or after reading the overview.
