- Analytics
- Technical Analysis
NZD USD Technical Analysis - NZD USD Trading: 2017-09-21
Improving growth is bullish for New Zealand dollar
New Zealand economy accelerated in the second quarter. Will the New Zealand dollar continue strengthening?
New Zealand economy accelerated in the second quarter: Q2 GDP rose 0.8% on quarter, up from upgraded 0.6% in first three months of 2017. Improving global economic performance is a major factor in boosting New Zealand economy as evidenced by higher export demand and improving terms of trade in last three quarters. The Reserve Bank of New Zealand kept the official cash rate on hold at 1.75% at its August 10 meeting. The central bank anticipated improved economic performance. The next RBNZ meeting is scheduled for September 28. No change in policy is expected as the central bank indicated monetary policy will remain accommodative for a considerable period and is reluctant to raise rates which may hurt economic growth. Improving economic growth is bullish for New Zealand dollar.
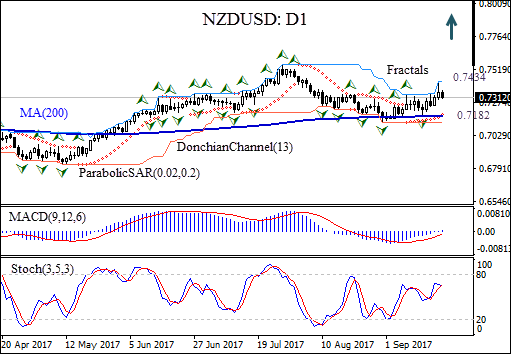
The NZDUSD: D1 has been correcting upward afte hitting 3-month low in the beginning of September on the daily chart. The price is above the 200-day moving average MA(200) which is rising.
- Parabolic indicator gives a buy signal.
- The Donchian channel indicates uptrend: it is tilted upward.
- The MACD indicator gives a bullish signal.
- The stochastic oscillator is declining and has not reached the oversold zone.
We believe the bullish momentum will continue after the price closes above the upper Donchian boundary at 0.7434. A pending order to buy can be placed above that level. The stop loss can be placed below the last fractal low at 0.7182. After placing the order, the stop loss is to be moved every day to the next fractal low, following Parabolic signals. Thus, we are changing the probable profit/loss ratio to the breakeven point. The most risk-averse traders may switch to the 4-hour chart after the trade and place there a stop-loss moving it in the direction of the trade. If the price meets the stop loss level (0.7182) without reaching the order (0.7434), we recommend canceling the position: the market sustains internal changes which were not taken into account.
Technical Analysis Summary
| Position | Buy |
| Buy stop | Above 0.7434 |
| Stop loss | Below 0.7182 |
Explore our
Trading Conditions
- Spreads from 0.0 pip
- 30,000+ Trading Instruments
- Stop Out Level - Only 10%
Ready to Trade?
Open Account Note:
This overview has an informative and tutorial character and is published for free. All the data, included in the overview, are received from public sources, recognized as more or less reliable. Moreover, there is no guarantee that the indicated information is full and precise. Overviews are not updated. The whole information in each overview, including opinion, indicators, charts and anything else, is provided only for familiarization purposes and is not financial advice or а recommendation. The whole text and its any part, as well as the charts cannot be considered as an offer to make a deal with any asset. IFC Markets and its employees under any circumstances are not liable for any action taken by someone else during or after reading the overview.
