- Analytics
- Technical Analysis
WTI Crude Technical Analysis - WTI Crude Trading: 2019-04-29
US President Appeals to OPEC
Oil quotations fell by about 3-4% after US President Donald Trump called on OPEC to increase production. Will the correction of WTI quotations continue ?
From its last low on December, it was up 56%. The local maximum was set on Tuesday, April 23rd. The main reason for such rapid growth was the decision of OPEC and independent producers to limit production from the beginning of 2019 by 1.2 million barrels per day (BVD), as well as US economic sanctions against Iran and Venezuela. In addition to Trump’s statement, the outlined correction in world oil prices was aided by rumors that the United States could soften its sanctions against Iran in order to increase supply in the oil market. The main factor of correction may be signals of a slowdown in the global economy. Therefore, oil quotations can respond to macroeconomic data and forecasts in the largest consumer countries.
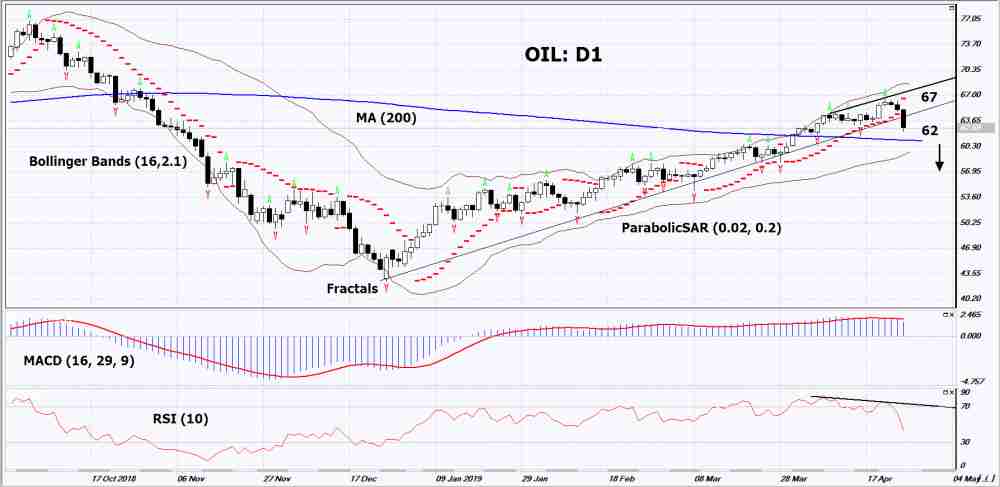
On the daily timeframe, OIL: D1 broke through the support line of uptrend. Most of technical analysis indicators have formed downtrend signals. A drop in prices is possible in the event of a slowdown in the global economy and an increase in oil production.
- The Parabolic indicator gives a bearish signal.
- The Bollinger bands expanded, indicating volatility increase. The top line slopes down.
- The RSI indicator is below 50. It has formed a divergence to a decrease.
- The MACD indicator gives a bearish signal.
The bearish momentum may develop in case OIL will drop below its last minimum: 62. This level may serve as an entry point. The stop loss may be placed higher than the last upper fractal, the Parabolic signal and the maximum since October 2018: 67. After opening a pending order, we shall move the stop to the next fractal maximum following Bollinger Bands and Parabolic indicator. Thus, we are changing the potential profit/loss to the breakeven point. More risk-averse traders may switch to the 4-hour chart after the trade and place there a stop loss moving it in the direction of the trade. If the price meets the stop level (67) without reaching the order (62), we recommend to close the position: the market sustains internal changes that were not taken into account.
Technical Analysis Summary
| Position | Sell |
| Sell stop | Below 62 |
| Stop loss | Above 67 |
- Get Certificate

Note:
This overview has an informative and tutorial character and is published for free. All the data, included in the overview, are received from public sources, recognized as more or less reliable. Moreover, there is no guarantee that the indicated information is full and precise. Overviews are not updated. The whole information in each overview, including opinion, indicators, charts and anything else, is provided only for familiarization purposes and is not financial advice or а recommendation. The whole text and its any part, as well as the charts cannot be considered as an offer to make a deal with any asset. IFC Markets and its employees under any circumstances are not liable for any action taken by someone else during or after reading the overview.
