- Analytics
- Technical Analysis
Soybean Trade Technical Analysis - Soybean Trade Trading: 2017-08-18
No bullish developments for soybean prices yet
Expected record US, South American and Chinese crops and favorable weather are bearish for soybeans. Will soybean prices continue the decline?
Soybeans prices fell sharply after the US Department of Agriculture's August 10 WASDE report on world crop supplies and demand reversed ideas of a drop in world soybean supplies in 2017-18. The surprise national yield upgrade from 48.0 to 49.4 bushels per acre was also bearish for soybeans. The weather forecasts predicting rains in many areas over the next week are also bearish for soybeans. At the same time US department of Agriculture August 14 crop progress report indicated marginal decline in weekly crop conditions from 60% down to just 59% reported "Good-to-Excellent". However market analysts tend to discount weekly crop conditions reports compared with monthly WASDE estimates as crop conditions are based more on survey results while the WASDE includes also estimates based on field samples. Taking into account also record large South American crop and bigger than last year Chinese crop no major boost to soybeans price is anticipated in short term prospect.
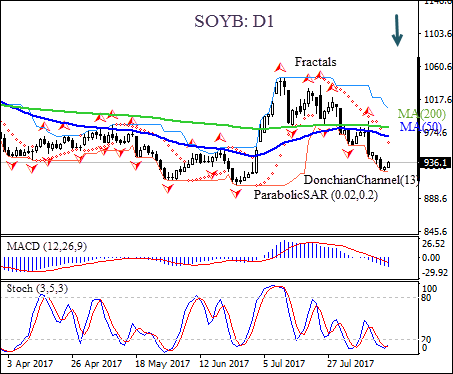
On the daily timeframe SOYBEAN: D1 has been trading with negative bias after retracing to seven-month high in mid-May. The price is below the 50-day moving average MA(50) which is under the 200-day moving average MA(200), with both averages starting to decline as the gap between the two widens. This is also bearish.
- The Donchian channel is tilted downward indicating downtrend.
- The Parabolic indicator has formed a sell signal.
- The MACD indicator is below the signal line and the gap is widening, which is bearish.
- The stochastic oscillator is rising from the oversold zone, this is a bullish signal.
We believe the bearish momentum will continue after the price closes below the lower boundary of Donchian channel at 923.5. This level can be used as an entry point for placing a pending order to sell. The stop loss can be placed above last fractal high at 989.4. After placing the order, the stop loss is to be moved every day to the next fractal high, following Parabolic signals. Thus, we are changing the probable profit/loss ratio to the breakeven point. If the price meets the stop loss level (989.4) without reaching the order (923.5), we recommend cancelling the position: the market has undergone internal changes which were not taken into account.
Technical Analysis Summary
| Position | Sell |
| Sell stop | Below 923.5 |
| Stop loss | Above 989.4 |
- Get Certificate

Note:
This overview has an informative and tutorial character and is published for free. All the data, included in the overview, are received from public sources, recognized as more or less reliable. Moreover, there is no guarantee that the indicated information is full and precise. Overviews are not updated. The whole information in each overview, including opinion, indicators, charts and anything else, is provided only for familiarization purposes and is not financial advice or а recommendation. The whole text and its any part, as well as the charts cannot be considered as an offer to make a deal with any asset. IFC Markets and its employees under any circumstances are not liable for any action taken by someone else during or after reading the overview.
