- Analytics
- Technical Analysis
S&P 500 Technical Analysis - S&P 500 Trading: 2015-07-08
Moving Average 200 may be breached
Let us consider the stock index Standard & Poor’s 500 (S&P500) CFD. The instrument is quoted in dollars. We do not exclude further pullback. On the back of economic slowdown Chinese stocks have plunged 30% for 3 last weeks. The negative trend may spread to other stock markets, including the American one. There is another important factor – the expected rate hike by Fed may increase companies' loan exposure. Corporate reporting season kicks out in the US this week. Most market participants expect corporate income to fall 3.1% in the second quarter. This does not seem very optimistic if we take into consideration S&P 500 poor performance since the start of the year: investors might have earned nothing. We would like to point out that Federal Reserve Chair Janet Yellen will speak on Friday; her report may have impact on financial markets.
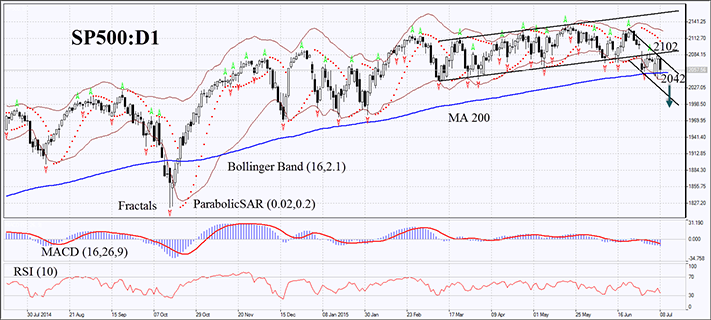
On the daily time frame the SP500 chart switched to the bearish trend. At the moment it is trying to breach the 200-day Moving Average. If it succeeds, the movement may accelerate. Parabolic and MACD have given sell signals. MACD bars have started growing, while Bollinger Bands have expanded, which may indicate volatility growth and trend strengthening. RSI-Bars has not yet reached the oversold zone. We expect the bearish momentum to continue after the next index bar closes below the MA 200, the yesterday low and the lower Bollinger boundary at 2042. A stop loss may be placed above the daily gap and the Parabolic signal at 2102. After pending order placing the stop loss is supposed to be moved every four hours near the next fractal high, following Bollinger and Parabolic signals. Thus, we are changing the probable profit/loss ratio to the breakeven point. The most cautious traders are recommended to switch to the H4 time frame and place a stop loss, moving it after the trend. If the price reaches the stop loss without triggering the order we recommend to cancel the position: the market sustains internal changes that were not considered.
| Position | Sell |
| Sell stop | below 2042 |
| Stop loss | above 2102 |
Explore our
Trading Conditions
- Spreads from 0.0 pip
- 30,000+ Trading Instruments
- Stop Out Level - Only 10%
Ready to Trade?
Open Account Note:
This overview has an informative and tutorial character and is published for free. All the data, included in the overview, are received from public sources, recognized as more or less reliable. Moreover, there is no guarantee that the indicated information is full and precise. Overviews are not updated. The whole information in each overview, including opinion, indicators, charts and anything else, is provided only for familiarization purposes and is not financial advice or а recommendation. The whole text and its any part, as well as the charts cannot be considered as an offer to make a deal with any asset. IFC Markets and its employees under any circumstances are not liable for any action taken by someone else during or after reading the overview.
