- Analytics
- Technical Analysis
USD CAD Technical Analysis - USD CAD Trading: 2015-06-24
Quarter GDP
Let us consider the USD/CAD currency pair on the H4 time frame. The price has crossed upwards the H4 trend line, shaping the first bullish signal. We observe a pullback at the moment. Yet, there is every reason to believe that the quarter GDP release, expected at 14:30 CET, will determine the trend. The ParabolicSAR indicator has turned towards the green zone. Donchian Channel has been demonstrating a positive slope. The RSI-Bars oscillator does not contradict our assumptions: its signal has already passed the substantial resistance line at 1.23615 (the breach is marked with a red oval).
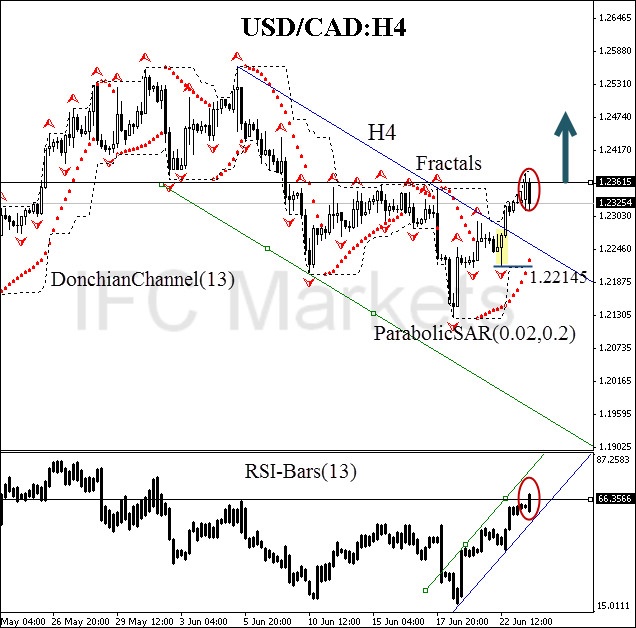
We suppose that all the represented analysis tools give bullish signals. The terminal impulse is anticipated after breaking out the important resistance line at 1.23615, which was confirmed by four Bill Williams fractals and the Donchian Channel boundary. A buy pending order may be placed at this mark. A stop loss may be placed at the channel opposite boundary at 1.22145. This level is assured by Parabolic historical values. The further bullish momentum is supposed to be confirmed by breaching the oscillator resistance at 66%. Conservative traders are recommended to monitor this signal. The stop loss is supposed to be moved every four hours to the next fractal low, following Parabolic signals. Thus, we are changing the probable profit/loss ratio to the breakeven point.
| Position | Buy |
| Buy stop | above 1.23615 |
| Stop loss | below 1.22145 |
- Get Certificate

Note:
This overview has an informative and tutorial character and is published for free. All the data, included in the overview, are received from public sources, recognized as more or less reliable. Moreover, there is no guarantee that the indicated information is full and precise. Overviews are not updated. The whole information in each overview, including opinion, indicators, charts and anything else, is provided only for familiarization purposes and is not financial advice or а recommendation. The whole text and its any part, as well as the charts cannot be considered as an offer to make a deal with any asset. IFC Markets and its employees under any circumstances are not liable for any action taken by someone else during or after reading the overview.
