- Analytics
- Technical Analysis
USD JPY Technical Analysis - USD JPY Trading: 2014-12-26
Outrunning signal
Let’s consider the H4 chart of USD/JPY instrument. In spite of long-term bullish mood (D1,W1,…) we observe a downwards correction. Price crossed an upward H4 trend line and entered a narrow range of 119.829-120.927. In case of a flat motion signals of leading oscillators are extremely important. That’s why we recommend paying attention at RSI-Bars patterns. We observe that an upward tendency slowly turns to the red zone – look at the trends fan. Then a formation of a new bullish trend was fixed (marked by the red corridor) and a simultaneous breakdown of the support level occurred. In such a way the oscillator sent an outrunning signal to the most prudent investors – a direction choice became obvious. The 119.829 support may be used for the pending sell order placement. Risk mitigation may be tied to the fractal resistance of 120.927. This key level was confirmed by the historical values of ParabolicSAR, the upper boundary of Donchian Channel and the intersection of a previous H4 trend line. We suppose that the given scheme of risk control should be comfortable for conservative traders.
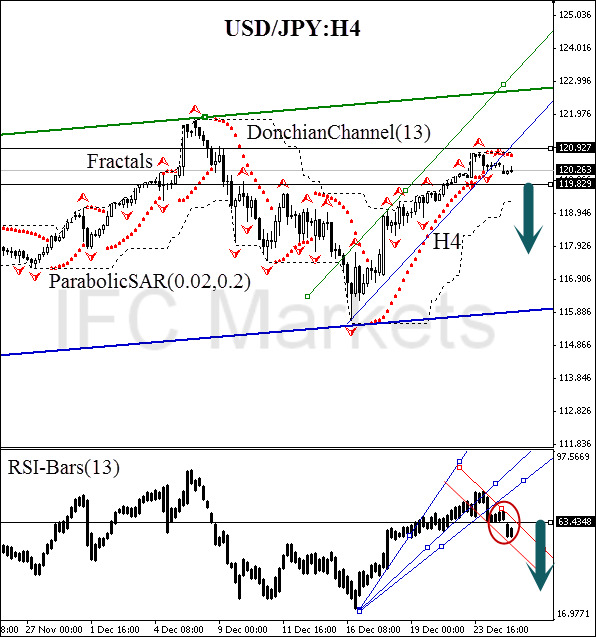
| Position | Sell |
| Sell stop | below 119.829 |
| Stop loss | above 120.927 |
- Get Certificate

Note:
This overview has an informative and tutorial character and is published for free. All the data, included in the overview, are received from public sources, recognized as more or less reliable. Moreover, there is no guarantee that the indicated information is full and precise. Overviews are not updated. The whole information in each overview, including opinion, indicators, charts and anything else, is provided only for familiarization purposes and is not financial advice or а recommendation. The whole text and its any part, as well as the charts cannot be considered as an offer to make a deal with any asset. IFC Markets and its employees under any circumstances are not liable for any action taken by someone else during or after reading the overview.
