- Analytics
- Technical Analysis
US Dollar Index Technical Analysis - US Dollar Index Trading: 2018-07-18
Fed continues the rate hike policy
Jerome Powell, chairman of the Federal Reserve, spoke during the Senate Banking Committee hearings. They were dedicated to the monetary policy. Powell, in particular, announced a gradual rate hike. Will the US dollar index prices rise?
As a rule, a rate hike increases the attractiveness of the currency and contributes to its exchange rate growth. The last Fed rate hike was a month ago and now it is 1.75-2%. Market participants believe that before the end of 2018, the US regulator will increase the rate twice and can do that 3 more times in 2019. Note that the rate is now below the inflation level, which was 2.3% in annual terms in June. The next Fed meeting will take place on August 1. Besides inflation, the US regulator takes into account the state of the labor market when deciding to change the rate. In particular, a low unemployment rate is required for its growth. In June, this indicator was only 4%, which is close to the long-term lows in the US. Along with moderate inflation, the labor market, according to investors, allows the Fed to tighten monetary policy.
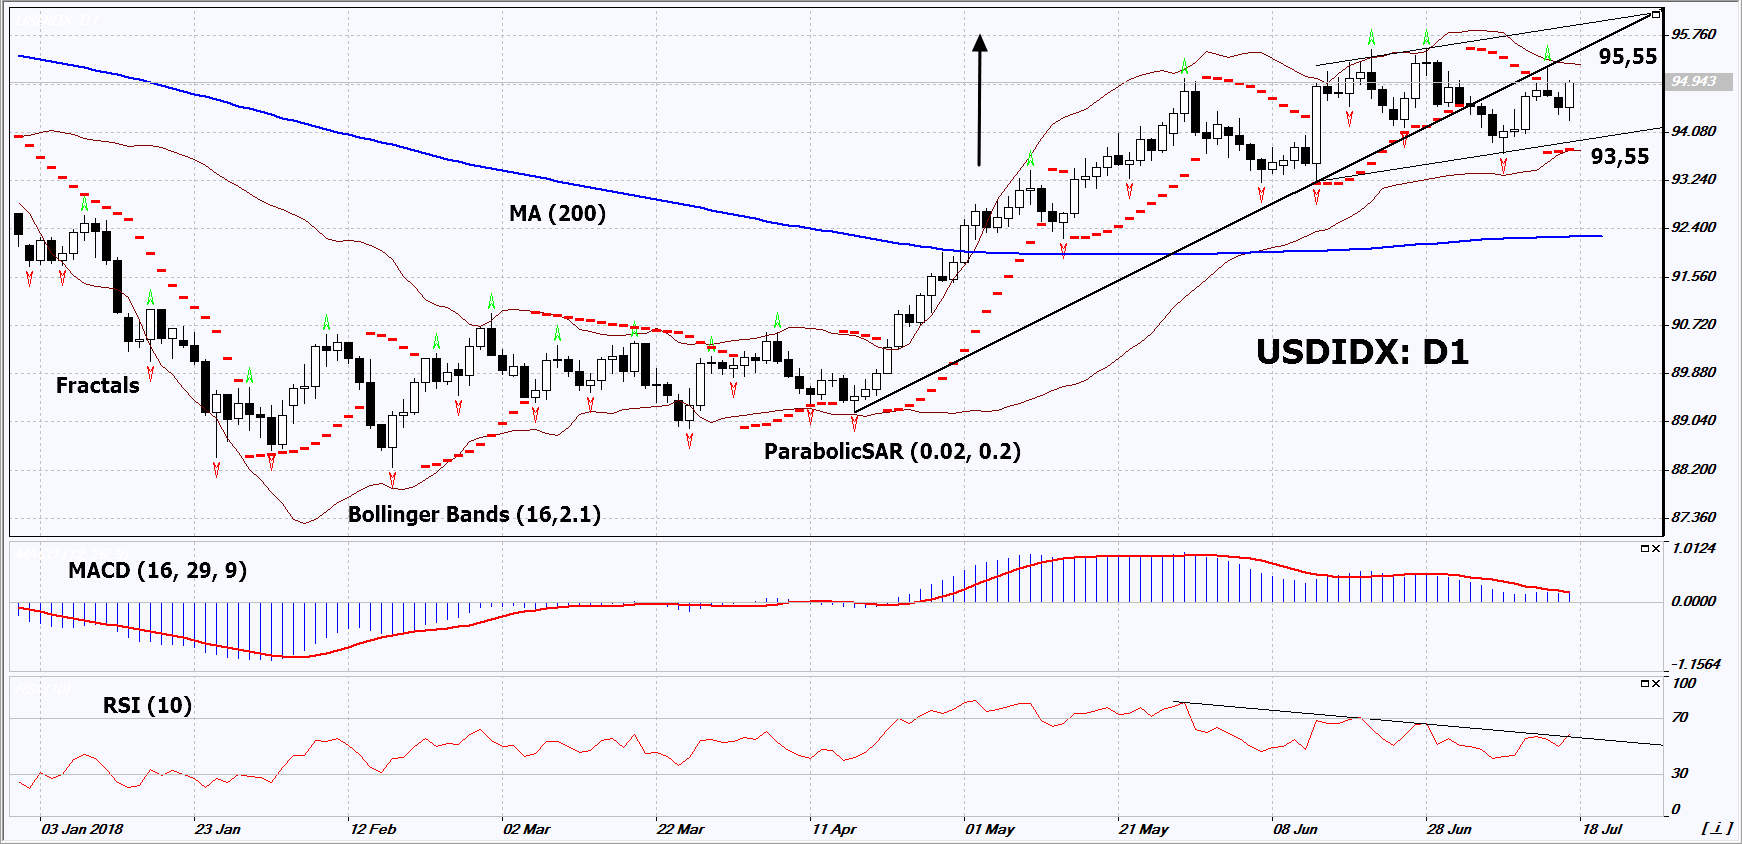
On the daily timeframe, USDIDX: D1 is in the rising channel. A number of technical analysis indicators formed buy signals. The further price increase is possible in case of the publication of positive economic statistics in the US.
- The Parabolic indicator gives a bullish signal.
- The Bollinger bands have narrowed, which indicates low volatility.
- The RSI indicator is above 50. No divergence.
- The MACD indicator gives a bullish signal.
The bullish momentum may develop in case USDIDX exceeds the two last fractal highs, the 1-year high and the upper Bollinger band at 95.55. This level may serve as an entry point. The initial stop loss may be placed below the last fractal low, the Parabolic signal and lower Bollinger band at 93.65. After opening the pending order, we shall move the stop to the next fractal low following the Bollinger and Parabolic signals. Thus, we are changing the potential profit/loss to the breakeven point. More risk-averse traders may switch to the 4-hour chart after the trade and place there a stop loss moving it in the direction of the trade. If the price meets the stop level (93.65) without reaching the order (95,55), we recommend to close the position: the market sustains internal changes that were not taken into account.
Summary of technical analysis
| Position | Buy |
| Buy stop | Above 95,55 |
| Stop loss | Below 93,65 |
- Get Certificate

Note:
This overview has an informative and tutorial character and is published for free. All the data, included in the overview, are received from public sources, recognized as more or less reliable. Moreover, there is no guarantee that the indicated information is full and precise. Overviews are not updated. The whole information in each overview, including opinion, indicators, charts and anything else, is provided only for familiarization purposes and is not financial advice or а recommendation. The whole text and its any part, as well as the charts cannot be considered as an offer to make a deal with any asset. IFC Markets and its employees under any circumstances are not liable for any action taken by someone else during or after reading the overview.
