- Analytics
- Technical Analysis
WHEAT Technical Analysis - WHEAT Trading: 2018-06-12
Preparing for the publication of the USDA forecast
On Tuesday, June 12, the U.S. Department of Agriculture (USDA) will publish its monthly forecast World Agricultural Supply and Demand Estimates (WASDE). Will wheat prices fall?
The USDA data will be released at 18-00 CET. They can have an impact not only on wheat prices, but also on soybean and corn. Market participants expect an increase in US wheat reserves at the end of the 2017-2018 and 2018-2019 seasons, as well as its world production in the 2018-2019 season. Wheat prices are falling for the second day in a row amid rainy weather in Australia, which is a positive factor for the harvest. Before that, they have fallen much less than soybean and maize prices. The drought in the EU and Eastern European countries supports wheat prices. In particular, because of the drought, there is a risk of a 5.5% reduction in wheat harvest in Ukraine compared to the last year, as well as 3% in Russia and 2% in the EU countries.
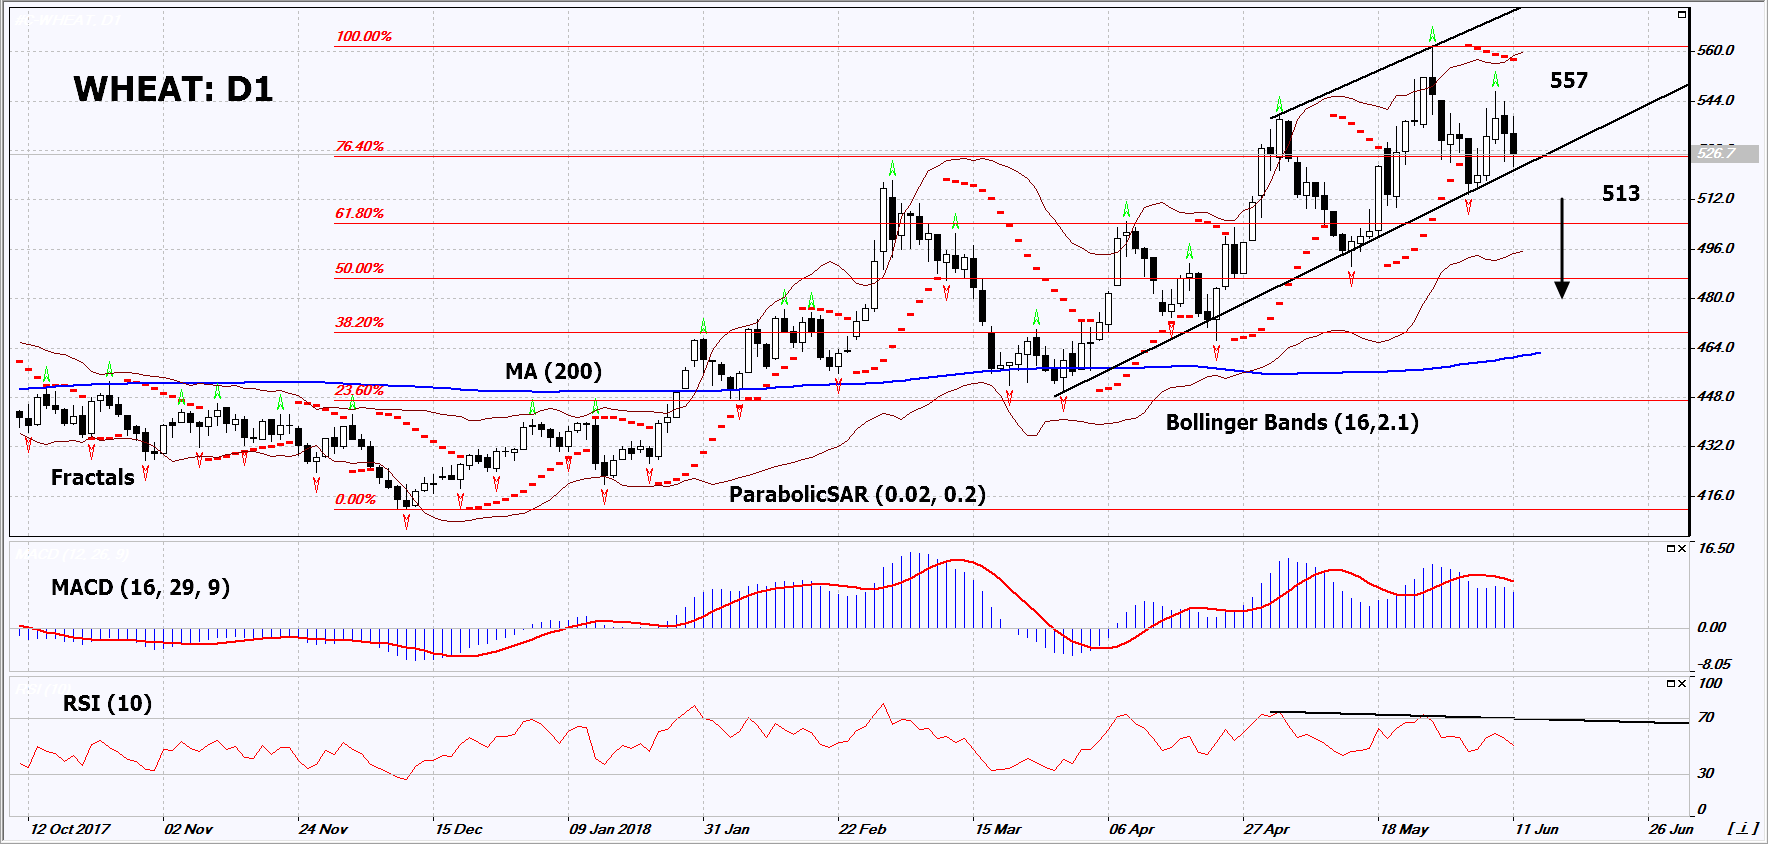
On the daily timeframe, WHEAT: D1 breached down the support line of the rising trend. The further price decrease is possible in case of a reduction in purchases of US corn by Mexico and with the further selling of Chinese state reserves.
- The Parabolic indicator gives a bearish signal.
- The Bollinger bands have narrowed, which indicates low volatility. They are titled down.
- The RSI indicator is below 50. It has formed a negative divergence.
- The MACD indicator gives bearish signals.
The bearish momentum may develop in case WHEAT falls below its last fractal low at 513. This level may serve as an entry point. The initial stop loss may be placed above the last fractal high and the Parabolic signal at 557. After opening the pending order, we shall move the stop to the next fractal high following the Bollinger and Parabolic signals. Thus, we are changing the potential profit/loss to the breakeven point. More risk-averse traders may switch to the 4-hour chart after the trade and place there a stop loss moving it in the direction of the trade. If the price meets the stop level at 557 without reaching the order at 513, we recommend to close the position: the market sustains internal changes that were not taken into account.
Summary of technical analysis
| Position | Sell |
| Sell stop | Below 513 |
| Stop loss | Above 557 |
- Get Certificate

Note:
This overview has an informative and tutorial character and is published for free. All the data, included in the overview, are received from public sources, recognized as more or less reliable. Moreover, there is no guarantee that the indicated information is full and precise. Overviews are not updated. The whole information in each overview, including opinion, indicators, charts and anything else, is provided only for familiarization purposes and is not financial advice or а recommendation. The whole text and its any part, as well as the charts cannot be considered as an offer to make a deal with any asset. IFC Markets and its employees under any circumstances are not liable for any action taken by someone else during or after reading the overview.
