- Analytics
- Technical Analysis
Silver vs Pesos Technical Analysis - Silver vs Pesos Trading: 2018-02-19
Silver growth lags behind gold
In this review, we suggest considering the personal composite instrument (PCI) &XAGMXN. It reflects the price dynamics of silver against the Mexican peso. Will the XAGMXN quotes grow?
Their increase means a rise in silver prices and a weakening of the Mexican peso. The Mexican economic state does not inspire much optimism. In December of the last year, the industrial production declined for the fourth month in a row in annual terms. The foreign trade balance was negative. Since late December 2017, the Mexican peso has strengthened against the US dollar by 7%. This occurred on the background of another increase in the Bank of Mexico rate to 7.5%. The rate hike policy began in November 2015, when it was 3%. As we can see, there has been a significant increase during this time and the Bank of Mexico may take a pause which could weaken the peso. On February 23, the GDP for the Q4 of 2017 will be released in Mexico. It is expected to decline by 0.3% compared with the Q3. In turn, silver may advance against gold, which showed the highest weekly growth in almost 2 years.
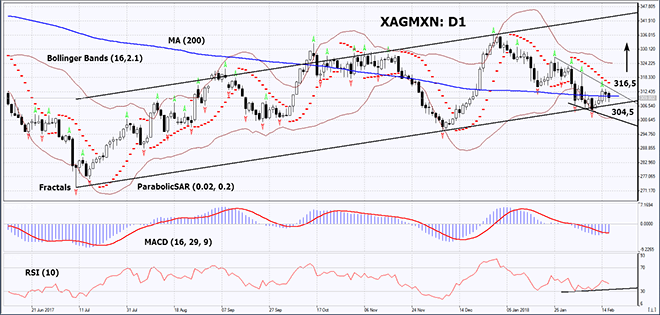
On the daily timeframe, XAGMXN: D1 approached the lower boundary of the rising trend. We assume, it will not be able to breach the rising trend down. In this case you should cancel the position. The further price increase is possible in case of the publication of negative economic data in Mexico, as well as in case of a further increase in precious metals’ prices.
- The Parabolic indicator gives a bearish signal. It may be used as an additional resistance level, which needs to be overcome to open a Buy position.
- The Bollinger bands have narrowed, which means lower volatility. They are tilted upwards.
- The RSI indicator is below 50. It has formed a positive divergence.
- The MACD indicator gives a bullish signal.
The bullish momentum may develop in case XAGMXN exceeds the last fractal high and the Parabolic signal at 316.5. This level may serve as an entry point. The initial stop loss may be placed below the last fractal low at 304.5. After opening the pending order, we shall move the stop to the next fractal low following the Bollinger and Parabolic signals. Thus, we are changing the potential profit/loss to the breakeven point. More risk-averse traders may switch to the 4-hour chart after the trade and place there a stop loss moving it in the direction of the trade. If the price meets the stop level at 304.5 without reaching the order at 316.5, we recommend cancelling the position: the market sustains internal changes that were not taken into account.
Summary of technical analysis
| Position | Buy |
| Buy stop | above 316,5 |
| Stop loss | below 304,5 |
- Get Certificate

Note:
This overview has an informative and tutorial character and is published for free. All the data, included in the overview, are received from public sources, recognized as more or less reliable. Moreover, there is no guarantee that the indicated information is full and precise. Overviews are not updated. The whole information in each overview, including opinion, indicators, charts and anything else, is provided only for familiarization purposes and is not financial advice or а recommendation. The whole text and its any part, as well as the charts cannot be considered as an offer to make a deal with any asset. IFC Markets and its employees under any circumstances are not liable for any action taken by someone else during or after reading the overview.
