- Analytics
- Technical Analysis
DE 30 Technical Analysis - DE 30 Trading: 2018-01-04
Stronger euro bearish for DE 30 index
Stronger euro is bearish for German stock market. Will DE 30 continue declining?
Euro got a boost from European Central Bank policy maker Benoit Coeure comment over the weekend “there is a reasonable chance that the extension of our asset purchase program decided in October can be the last.” The ECB in October decided to extend its quantitative easing to the end of September 2018, although at a slower pace of €30 billion a month instead of €60 billion of monthly bond purchases. Ending monetary stimulus program of bond purchases on improving data is bullish for euro and bearish for the German DE 30 stock index.
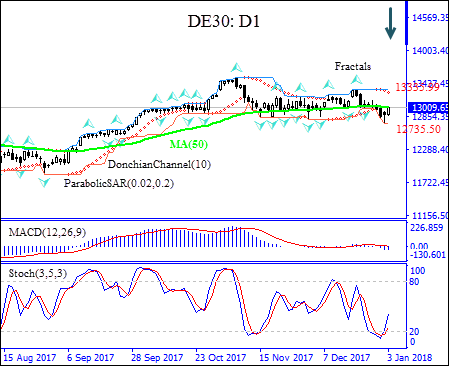
On the daily timeframe DE 30: D1 has been retracing after hitting two-month high three weeks ago. The price has fallen below the 50-day moving average MA(50).
- The Donchian channel indicates no trend yet: it is flat.
- The Parabolic indicator has formed a sell signal.
- The MACD indicator is bearish: it is below the signal line and the gap is widening.
- The stochastic oscillator is rising but hasn’t reached the overbought zone.
We believe the bearish momentum will continue after the price closes below the lower boundary of Donchian channel at 12735.5. This level can be used as an entry point for placing a pending order to buy. The stop loss can be placed above the upper Donchian bound at 13335.99. After placing the order, the stop loss is to be moved every day to the next fractal high, following Parabolic signals. Thus, we are changing the probable profit/loss ratio to the breakeven point. If the price meets the stop loss level (13335.99) without reaching the order (12735.5), we recommend cancelling the order: the market has undergone internal changes which were not taken into account.
Technical Analysis Summary
| Position | Sell |
| Sell stop | Below 12735.5 |
| Stop loss | Above 13335.99 |
- Get Certificate

Note:
This overview has an informative and tutorial character and is published for free. All the data, included in the overview, are received from public sources, recognized as more or less reliable. Moreover, there is no guarantee that the indicated information is full and precise. Overviews are not updated. The whole information in each overview, including opinion, indicators, charts and anything else, is provided only for familiarization purposes and is not financial advice or а recommendation. The whole text and its any part, as well as the charts cannot be considered as an offer to make a deal with any asset. IFC Markets and its employees under any circumstances are not liable for any action taken by someone else during or after reading the overview.
