- Analytics
- Technical Analysis
FR 40 Technical Analysis - FR 40 Trading: 2019-10-04
Declining composite PMI bearish for FR40
French private sector activities declined in September. Will the FR40 stock index continue declining?
French economic data were negative on balance after slowing inflation report a week ago: while retail sales rose in August, private sector expansion slowed in September. Retail sales grew 2.3% over year in August after 1.4% growth in July, while both manufacturing and services sectors PMI’s declined in September: to 50.1 from 51.1 and 51.1 from 53.4 respectively. As a result Markit’s composite PMI declined to 50.8 from 52.9 in August. Readings below 50 indicate contraction. Slowing private sector activity is bearish for French equities index.
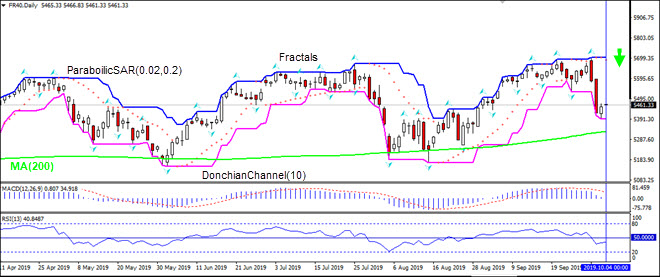
On the daily timeframe FR40: D1 has approached the 200-day moving average MA(200) which is still rising.
- The Donchian channel indicates downtrend: it is widening down.
- The Parabolic indicator has formed a sell signal.
- The MACD indicator gives a bearish signal.
- The RSI oscillator is below 50 mark and level.
We believe the bearish momentum will continue as the price breaches below the lower boundary of Donchian channel at 5408.38. This level can be used as an entry point for placing a pending order to sell. The stop loss can be placed above the fractal high at 5702.43. After placing the order, the stop loss is to be moved every day to the next fractal low, following Parabolic signals. Thus, we are changing the expected profit/loss ratio to the breakeven point. If the price meets the stop loss level (5702.43) without reaching the order (5408.38), we recommend cancelling the order: the market has undergone internal changes which were not taken into account.
Technical Analysis Summary
| Order | Sell |
| Sell stop | Below 5408.38 |
| Stop loss | Above 5702.43 |
Explore our
Trading Conditions
- Spreads from 0.0 pip
- 30,000+ Trading Instruments
- Stop Out Level - Only 10%
Ready to Trade?
Open Account Note:
This overview has an informative and tutorial character and is published for free. All the data, included in the overview, are received from public sources, recognized as more or less reliable. Moreover, there is no guarantee that the indicated information is full and precise. Overviews are not updated. The whole information in each overview, including opinion, indicators, charts and anything else, is provided only for familiarization purposes and is not financial advice or а recommendation. The whole text and its any part, as well as the charts cannot be considered as an offer to make a deal with any asset. IFC Markets and its employees under any circumstances are not liable for any action taken by someone else during or after reading the overview.
