- Trading Platforms
- Platforms
- User Manuals
- NetTradeX Windows Manual
- Setting Indicators and Objects
Setting Indicators and Graphical Objects
You can set Indicators and Graphical objects on the charts of financial instruments.
1. Indicators
You can open the dialog of setting an indicator in the following ways:
- Select the "Chart" option from the main menu and in the opened context menu select "Indicators" option (it will be set on the chart).
- Right-click on the chart window and in the opened context menu select the "Indicators" option.
- On the upper panel of the terminal click on button-icon "f"(manage indicators).
The "Indicators" window will open, consisting of two sections - "Available indicators" and "Set indicators"
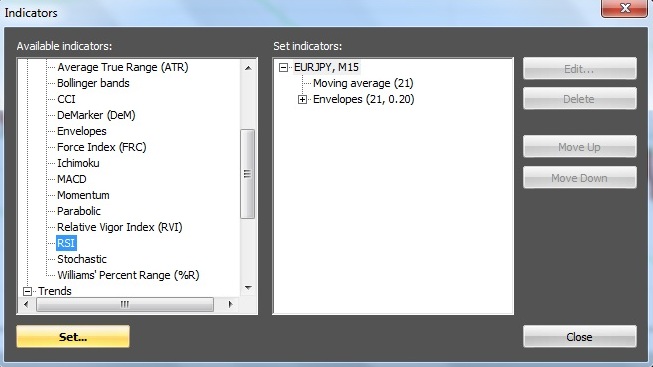
In the "Available instruments" section you can select an indicator from the full list and set it on the chart, by pressing "Set" in order to specify the indicator parameters.
As an example, the RSI indicator was selected and its dialog was opened:
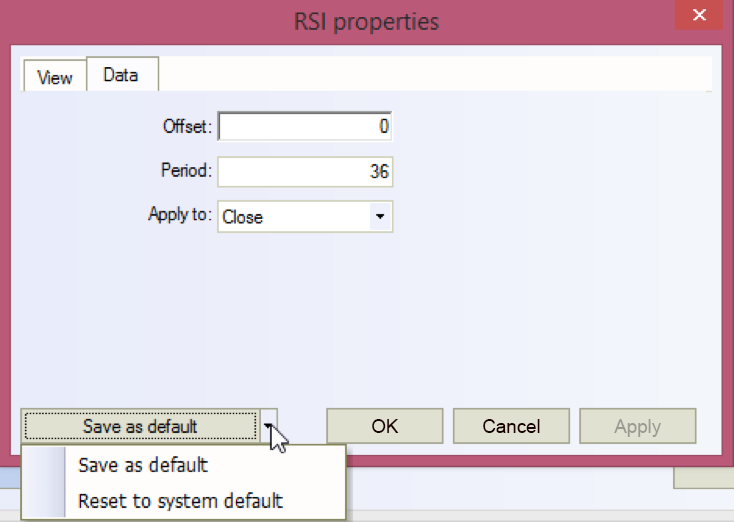
After specifying the indicator parameters, press "OK" and the indicator will be set on the chart.
In "Set indicators" section of the "Indicators" window you will see the list of all indicators set on the chart and you will be able to select the indicator that you want to modify or delete. To save the changes in the indicators on the chart press "Close" button.
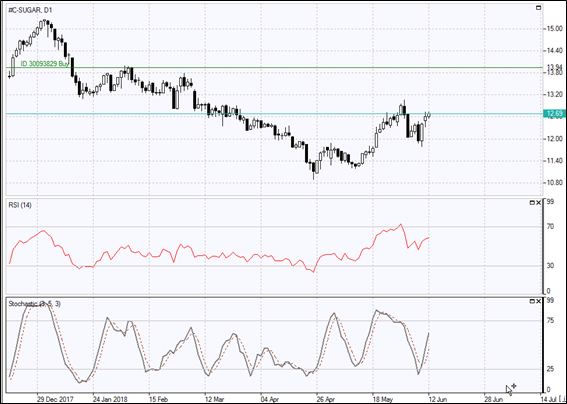
The set indicators are reflected on the chart or in a separate place below the chart.
Additionally, on the lines of several indicators you can build “Moving Average” indicator. To do it, right-click on the selected indicator in the "Set indicators" section on the right. In the "Available indicators…" section to the left the list of indicators will appear for additional setting.
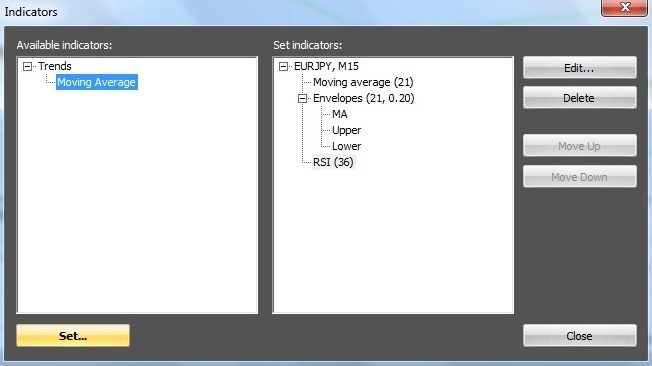
Press the indicator from the list and "Set" button. In the opened window set properties of the additional setting.
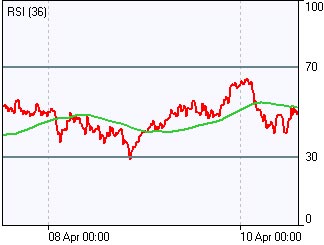
In our example on RSI line “Moving Average” indicator will be drawn (horizontal lines on RSI indicator can be added and edited as graphical objects):
2. Expansion of the chart areas
If there are indicators on the chart, for example, RSI, Stochastic, which occupy a separate area on the chart, then, there is a possibility to expand the chart area into the entire workspace for charts, and the area for one indicator to expand into the entire workspace for indicators. To do this, click on the button (in the form of a square) in the upper right corner of the corresponding chart area, and to return - on the button in the form of two rectangles.
3. Graphical objects
You can open the dialog window of setting Graphical objects in the following ways:
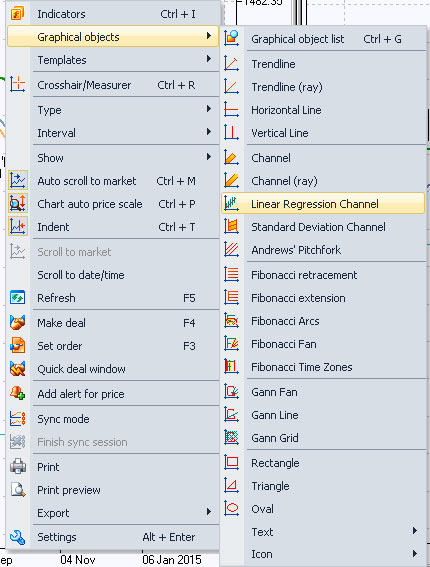
- Right-click on the chart window and select “Graphical objects” from the opened context menu.
- Press icon-button of calling a concrete graphical object in the upper panel of the terminal.
In the first case the list of graphical objects will open:
You can move the previously set Graphical object in the desired direction by holding the left mouse button.
In order to modify the parameters of the previously set Graphical object, move your mouse over the object and by double-clicking call the dialog window of setting the object properties.