

- Education
- Forex Technical Analysis
- Technical Indicators
- Bill Williams Indicators
- Market Facilitation Index
Market Facilitation Index indicator
The Market Facilitation Index indicator measures how efficiently price moves relative to trading volume, revealing when a trend has genuine strength or is quietly running out of steam. This guide explains what MFI is, how to read its four market phases, how to calculate it, and how to apply it directly on your trading platform.
DEFINITION:
Market facilitation index is the indicator which evaluates the willingness of the market to move the price. The indicator's absolute values alone cannot provide any trading signals unlike it's dynamics in relation to the dynamics of the volume.
Key Moments
- The Market Facilitation Index combines price range and volume data to reveal whether a price move is backed by genuine market participation.
- MFI splits price action into four distinct phases—Green, Fade, Fake, and Squat—each describing a different relationship between price and volume.
- Traders use MFI primarily to confirm trend strength or to spot early warning signs that momentum is weakening before price reverses.
- Unlike standalone volume indicators, MFI factors in the trading range itself, making it useful across forex, stocks, and commodities markets.
- Combining MFI with a volume histogram gives a clearer visual read on which of the four market phases is currently active.
What is Market Facilitation Index
The Market Facilitation Index is a technical indicator measuring how far price moves per unit of trading volume in a given period. Developed by trader Bill Williams, MFI reveals whether the market is genuinely driving price or simply churning without real direction. It divides each bar's price range by its volume, producing a single reading traders plot beside a volume histogram.
MFI belongs to a small family of tools built on the idea that price and volume together tell a fuller story than either alone. When volume rises but price range stays flat, the market is working hard without making real progress toward a new level. When volume and price range both expand together, that combination often signals a stronger, more sustainable trend.
Interpreting MFI depends on comparing its current reading and volume against the previous bar, not on reading the value in isolation. A rising MFI paired with rising volume typically points to a healthy, well-supported trend that traders can follow with confidence. A falling MFI alongside falling volume often warns that participants are losing interest and the move may stall.
Because MFI is unbounded and unitless, it is best read as a directional signal rather than a fixed threshold to buy or sell against. Most trading platforms plot MFI as a color-coded histogram beneath the price chart, making the four market phases easy to spot at a glance. This visual simplicity is a major reason MFI remains popular among traders who want a fast read on trend conviction.
MFI Indicator Strategy
The absolute values of the Market Facilitation index are represented by the histogram's bars while the comparison of the index and volume dynamics are given in colors which are vital in terms of reading the indicator signs.
- Green bar - both MFI and volume are up. Increasing trading activity means market movement acceleration. We may join the trend.
- Blue bar - MFI indicator is up, volume is down. The movement is continuing although the volume has dropped. The trend will soon be reversing.
- Pink bar - MFI indicator is down, volume is up. The slowing down movement while volume is raising may indicate a possible break through, often a U-turn.
- Brown bar - both MFI and volume are down. The market is no longer interested in the current direction and is looking for signs of a future development.
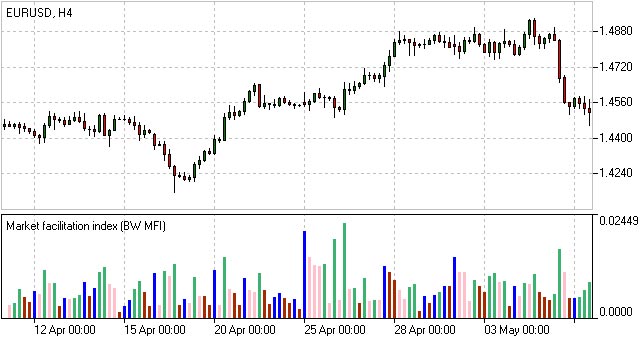
Market Facilitation Index (BW MFI)
How to Use MFI Indicator
Using the Market Facilitation Index effectively starts with adding it to your chart and pairing it with a volume histogram. From there, the process is straightforward once you know what each of the four MFI phases represents. Follow the steps below to start applying MFI to your own trading.
1. Create a Trading Account
Before you can apply the Market Facilitation Index to live markets, you'll need a trading account with a broker that supports the instruments you want to trade. You can open trading account in a few minutes to access real-time charts and indicator tools.
2. Choose Your Trading Platform
MFI is available as a built-in indicator on most major trading platforms, so pick the one that fits your workflow. Popular choices include MetaTrader 4, MetaTrader 5, and NetTradeX, all of which support MFI alongside a volume histogram.
3. Add MFI to Your Chart
Open the indicator list on your chosen platform, search for Market Facilitation Index, and attach it below your price chart. Pair it with a standard volume histogram so you can compare bar-to-bar changes in both readings side by side.
4. Identify the Four MFI Phases
Once MFI is plotted, learn to recognize its four color-coded phases: Green, Fade, Fake, and Squat. Each phase describes a different relationship between rising or falling price range and rising or falling volume, which is the core signal MFI provides.
5. Confirm Signals With Price Action
Use MFI readings alongside candlestick patterns, support and resistance levels, or trend lines rather than as a standalone trigger. This combination helps filter out false signals and improves the reliability of entries and exits.
6. Practice Before Trading Live
Test how MFI behaves across different market conditions using a demo account before applying it to real trades. This practice period helps you build confidence in reading the four phases correctly under real market speed.
How to Calculate MFI
Calculating the Market Facilitation Index is a simple two-step process that only requires a bar's high, low, and volume figures. Unlike more complex oscillators, MFI does not require historical averaging or smoothing, so it can be computed independently for each new bar. Most charting platforms calculate and plot this value automatically, but understanding the formula helps you interpret the result correctly.
MFI = (High − Low) / Volume
The formula divides the price range of a bar, its high minus its low, by that same bar's trading volume. A higher result means price traveled a large distance relative to volume, which can indicate strong directional interest from traders. A lower result means volume was heavy but price barely moved, often signaling indecision or a market running out of momentum.
Traders rarely calculate MFI by hand since trading platforms plot it automatically alongside a volume histogram in real time. What matters more than the raw number is how MFI and volume change together from one bar to the next. This bar-to-bar comparison is what produces the four market phases traders rely on for interpretation.
Conclusion
The Market Facilitation Index gives traders a straightforward way to judge whether price movement is backed by genuine market participation or empty volume. By tracking its four phases alongside a volume histogram, you can spot strengthening trends earlier and avoid moves that are likely to stall. As with any single indicator, MFI works best when combined with price action and other confirming tools rather than used in isolation.
Forex Indicators FAQ
What is a Forex Indicator?
Forex technical analysis indicators are regularly used by traders to predict price movements in the Foreign Exchange market and thus increase the likelihood of making money in the Forex market. Forex indicators actually take into account the price and volume of a particular trading instrument for further market forecasting.
What are the Best Technical Indicators?
Technical analysis, which is often included in various trading strategies, cannot be considered separately from technical indicators. Some indicators are rarely used, while others are almost irreplaceable for many traders. We highlighted 5 the most popular technical analysis indicators: Moving average (MA), Exponential moving average (EMA), Stochastic oscillator, Bollinger bands, Moving average convergence divergence (MACD).
How to Use Technical Indicators?
Trading strategies usually require multiple technical analysis indicators to increase forecast accuracy. Lagging technical indicators show past trends, while leading indicators predict upcoming moves. When selecting trading indicators, also consider different types of charting tools, such as volume, momentum, volatility and trend indicators.
Do Indicators Work in Forex?
There are 2 types of indicators: lagging and leading. Lagging indicators base on past movements and market reversals, and are more effective when markets are trending strongly. Leading indicators try to predict the price moves and reversals in the future, they are used commonly in range trading, and since they produce many false signals, they are not suitable for trend trading.

Not sure about your Forex skills level?
Take a Test and We Will Help You With The Rest
You can see the graphical object on the price chart by downloading one of the trading terminals offered by IFC Markets.



Was this article helpful?

 You can study CFD trading more thoroughly and see CFD trading examples in the section How To Trade CFDs Visit Educational Center