

- Education
- Forex Technical Analysis
- Chart Patterns
- Reversal Patterns
- Head and Shoulders
Reverse Head and Shoulders: Forex Chart Pattern
The Reverse Head and Shoulders pattern is one of the most reliable signals traders use to spot a shift from a downtrend to an uptrend. Recognizing it early can help you time entries before a major bullish reversal unfolds. Below, we break down its structure, formation, and how to trade it with confidence.
DEFINITION:
The Head and shoulders graphical price pattern signals the end of trend and the following change in direction of the asset’s price. It is typically formed in a developed uptrend.
Key Moments
- The Reverse Head and Shoulders is a bullish reversal pattern that typically forms after a sustained downtrend in price.
- It consists of three troughs, with the middle trough, or head, dipping lower than the two surrounding shoulders.
- A neckline connects the highs between the troughs, and a breakout above it confirms the reversal signal.
- Trading volume usually increases during the breakout, which adds confidence that the trend change is genuine.
- Traders often measure the distance from the head to the neckline to estimate a realistic target price for the move.
What is Head and Shoulders Pattern
The Reverse Head and Shoulders pattern signals that a prevailing downtrend may be losing momentum and reversing direction. It forms after price makes a low, bounces, falls to a deeper low, bounces again, then rises to a similar height as the first bounce. Traders across forex, stocks, and commodities rely on this structure to anticipate bullish turning points.
The pattern gets its name from its visual resemblance to a head flanked by two shoulders. The left shoulder and right shoulder sit at roughly equal price levels, while the head dips noticeably lower between them. This symmetry is what makes the pattern relatively easy to spot once you know what to look for.
A neckline is drawn by connecting the two peaks that separate the shoulders from the head. When price closes decisively above this neckline, it confirms that buyers have taken control of the market. Many traders treat this breakout as the actual trigger for entering a long position.
Because the pattern reflects a genuine shift in supply and demand, it tends to carry more weight than short-lived candlestick signals. Institutional traders and retail participants both watch for it on higher timeframes like the daily or weekly chart. This broad visibility often reinforces the strength of the eventual breakout.
Types of Head and Shoulders Pattern
While the classic Reverse Head and Shoulders appears at the bottom of a downtrend, its mirror image is the standard Head and Shoulders top. That version signals a bearish reversal after an uptrend has run its course. Understanding both variants helps traders recognize reversals in either market direction.
A further distinction exists between simple and complex formations. A simple pattern has one clear head and two shoulders, making it straightforward to identify on a price chart. A complex version may show two heads or two left and right shoulders, which still respects the same underlying logic.
Some traders also classify the pattern by the slope of its neckline. A flat neckline is considered the most reliable, since it shows balanced resistance between the two rally highs. A rising or falling neckline can still be valid, though it typically requires a stronger breakout to confirm the reversal.
How to Trade a Head and Shoulders Pattern
Trading the Reverse Head and Shoulders pattern effectively requires patience and a structured approach. The steps below walk through the process from spotting the setup to managing the trade once it's live.
Step 1: Identify the Pattern
Look for three distinct troughs on the chart, with the middle one lower than the two on either side. Confirm the pattern has formed after a clear and sustained downtrend, not during a sideways market.
Step 2: Draw the Neckline
Connect the two peaks between the shoulders and the head to plot your neckline. This line becomes the key level you'll watch for a confirmed breakout.
Step 3: Open a Trading Account
Before placing any trades, open a trading account with a regulated broker that offers the instruments you want to trade. This gives you access to live charts and execution tools needed to act on the pattern.
Step 4: Set Up Your Platform
Install MetaTrader 4 or MetaTrader 5 and load the chart of the asset you're monitoring. Both platforms offer the drawing tools needed to mark the neckline and track price action in real time.
Step 5: Confirm the Breakout
Wait for a candle to close above the neckline with noticeably higher trading volume. This confirmation reduces the risk of acting on a false or premature signal.
Step 6: Manage the Trade
Enter your position after confirmation, place a stop-loss below the right shoulder, and set a target based on the head-to-neckline distance. Adjust your position as price moves in your favor to protect accumulated gains.
How to Identify Head and Shoulders Pattern
Identifying the Reverse Head and Shoulders pattern starts with recognizing the broader market context. It only carries meaning after a clear downtrend, since it represents a genuine change in trend direction. Spotting it in a flat or choppy market often leads to unreliable signals.
Next, look closely at the three troughs and compare their depth and spacing. The head should be visibly lower than both shoulders, and the shoulders should sit at roughly similar price levels. Uneven or poorly defined troughs can weaken the reliability of the setup.
Volume behavior offers another useful clue during identification. Volume often declines through the formation of the head and increases again as the right shoulder develops. A surge in volume during the neckline breakout adds further confirmation that the pattern is valid.
Finally, cross-check the pattern against other technical indicators before acting. Momentum tools like the RSI or MACD can confirm whether buying pressure is genuinely building. Combining multiple signals reduces the chance of reacting to a false breakout.
Head and Shoulders Formation
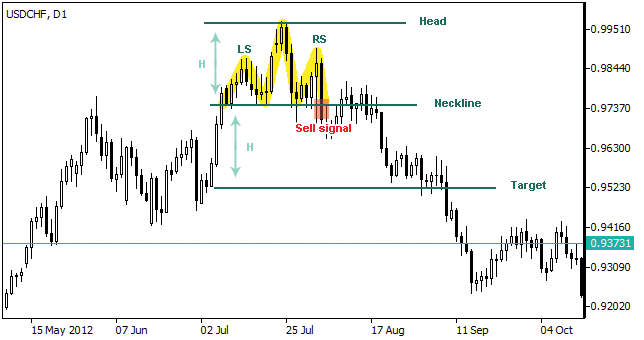
This pattern is represented by three tops of the market price located at different levels: two lower tops (shoulders) aside and one highest top (head) in between. There is also a neckline (support) connecting pattern’s lows.
Interpretation of Head and Shoulders
Once the pattern is formed and the price falls below the neckline or support level (plus a certain deviation is possible), investors get a sell signal. The expectation is that the decline will continue, although prices may rebound to the neckline, considered now a resistance, but generally stop around it.
Head and Shoulders Target Price
Following head and shoulders pattern formation the price is generally believed to drop at least to its target level, calculated as follows:
T = N – (H – N), Where:T – target level;
N – neckline level (initial support);
H – pattern’s head level (highest top).
Conclusion
The Reverse Head and Shoulders pattern remains one of the most trusted tools for spotting bullish reversals after a downtrend. Its clear structure, defined neckline, ad volume confirmation make it accessible even to traders new to technical analysis. Mastering this pattern adds a valuable signal to any trader's broader strategy.
Forex Indicators FAQ
What is a Forex Indicator?
Forex technical analysis indicators are regularly used by traders to predict price movements in the Foreign Exchange market and thus increase the likelihood of making money in the Forex market. Forex indicators actually take into account the price and volume of a particular trading instrument for further market forecasting.
What are the Best Technical Indicators?
Technical analysis, which is often included in various trading strategies, cannot be considered separately from technical indicators. Some indicators are rarely used, while others are almost irreplaceable for many traders. We highlighted 5 the most popular technical analysis indicators: Moving average (MA), Exponential moving average (EMA), Stochastic oscillator, Bollinger bands, Moving average convergence divergence (MACD).
How to Use Technical Indicators?
Trading strategies usually require multiple technical analysis indicators to increase forecast accuracy. Lagging technical indicators show past trends, while leading indicators predict upcoming moves. When selecting trading indicators, also consider different types of charting tools, such as volume, momentum, volatility and trend indicators.
Do Indicators Work in Forex?
There are 2 types of indicators: lagging and leading. Lagging indicators base on past movements and market reversals, and are more effective when markets are trending strongly. Leading indicators try to predict the price moves and reversals in the future, they are used commonly in range trading, and since they produce many false signals, they are not suitable for trend trading.

Not sure about your Forex skills level?
Take a Test and We Will Help You With The Rest
You can see the graphical object on the price chart by downloading one of the trading terminals offered by IFC Markets.



Was this article helpful?

 You can study CFD trading more thoroughly and see CFD trading examples in the section How To Trade CFDs Visit Educational Center