

- Education
- Forex Technical Analysis
- Technical Indicators
- Oscillators
- Percentage Price Oscilator
Percentage Price Oscillator
The Percentage Price Oscillator helps traders measure momentum in percentage terms, making trend strength comparable across different assets and price levels. Whether you trade forex, stocks, or indices, PPO can highlight momentum shifts early. This guide explains what PPO is, how to use it, and where it fits in your analysis.
Key Moments
- PPO expresses the gap between two exponential moving averages as a percentage, which makes readings comparable across different currency pairs, stocks, and commodities.
- The standard setting uses a 12-period fast average, a 26-period slow average, and a 9-period signal line to smooth the oscillator.
- A PPO crossover above its signal line often hints at strengthening bullish momentum, while a cross below suggests bearish pressure is building.
- Zero-line crossings show when the fast average moves above or below the slow average, signalling a possible change in the prevailing trend.
- Like every indicator, PPO works best alongside price action, support and resistance, and sound risk management rather than as a standalone signal.
What is Percentage Price Oscillator
The Percentage Price Oscillator is a momentum indicator showing the percentage gap between a fast and slow exponential moving average. It is closely related to the MACD, but it converts the result into a percentage instead of absolute price units. Traders use it to judge trend direction, momentum strength, and possible reversals on charts of any market or timeframe.
Gerald Appel created the MACD indicator in the late 1970s, and the PPO later emerged as its percentage-based variation. Because the output is a percentage, a reading of two percent is directly comparable across different assets. This makes the PPO especially useful when comparing a low-priced currency pair with a high-priced stock or index.
The indicator appears below the price chart and has three parts: the PPO line, signal line, and histogram. The histogram simply shows the distance between the PPO line and its signal line, making momentum shifts easier to spot. Beginners often find the PPO approachable because its rules are simple and its signals are visible at a glance.
Like all momentum tools, the PPO lags price because it relies on moving averages, so signals can arrive late. In sideways markets it may produce false crossovers, which is why traders confirm signals with other tools. The table below summarises the main advantages and drawbacks of using the indicator in everyday trading.
| Pros | Cons |
| Percentage-based, comparable across assets | Lags price because of moving averages |
| Easy-to-read crossovers and zero line | False signals in sideways markets |
| Works on any timeframe and market | Needs confirmation from other tools |
Percentage Price Oscillator Formula
The Percentage Price Oscillator (PPO) formula involves comparing two moving averages of the price data and expressing the difference as a percentage.
Here's the formula for calculating the PPO:
PPO = ((Short-term EMA - Long-term EMA) / Long-term EMA) * 100
Variables:
- PPO: The resulting value of the Percentage Price Oscillator, expressed as a percentage.
- Short-term EMA: The exponential moving average calculated based on a selected short-term period. It emphasizes recent prices and is more responsive to short-term price changes.
- Long-term EMA: The exponential moving average calculated based on a chosen long-term period. It provides a broader view of the price trend and is less sensitive to short-term fluctuations.
By using this formula, the PPO allows traders to assess the relative strength and momentum of price movements based on the difference between the short-term and long-term EMAs.
PPO Calculation
Let's break down the components of the formula:
- Short-term EMA: This represents the short-term exponential moving average, which is calculated based on a selected period of price data. The exponential moving average gives more weight to recent prices, making it responsive to short-term price changes.
- Long-term EMA: This denotes the long-term exponential moving average, calculated based on a longer period of price data. The long-term moving average provides a broader view of the price trend.
- Difference between Short-term EMA and Long-term EMA: Subtracting the long-term EMA from the short-term EMA gives us the numerical difference between the two moving averages.
- Divide by Long-term EMA: This difference is then divided by the long-term EMA to normalize the value and express it as a percentage.
- Multiply by 100: Finally, the resulting value is multiplied by 100 to convert it into a percentage.
By calculating the PPO using this formula, we obtain a percentage value that represents the difference between the short-term and long-term moving averages in relation to the long-term average. This percentage helps traders gauge the momentum and strength of price movements, aiding in trend identification and potential trading signals.
Remember that the specific period lengths for the short-term and long-term moving averages can vary based on individual preferences and market conditions. Additionally, it's important to note that different trading platforms or charting tools may offer variations in the PPO calculation, such as using different types of moving averages or applying additional smoothing techniques.
Percentage Price Oscillator Strategy
Using the Percentage Price Oscillator (PPO) involves several key steps to analyze price momentum and identify potential trading opportunities. Here's a guide on how to use the PPO effectively:
Applying the PPO
Start by plotting the PPO indicator on your price chart. The PPO line is typically displayed below the price chart, with a zero line running across the middle. This visual representation helps you assess the PPO values and their relationship to the price movements.
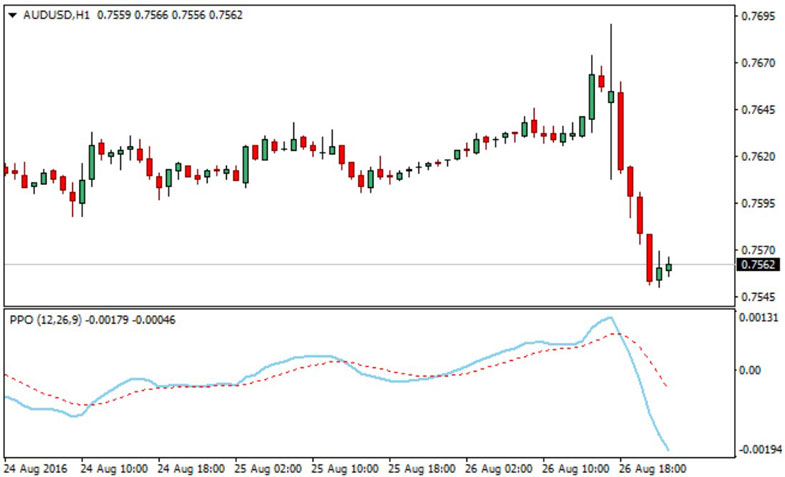
PPO Line Crosses Zero
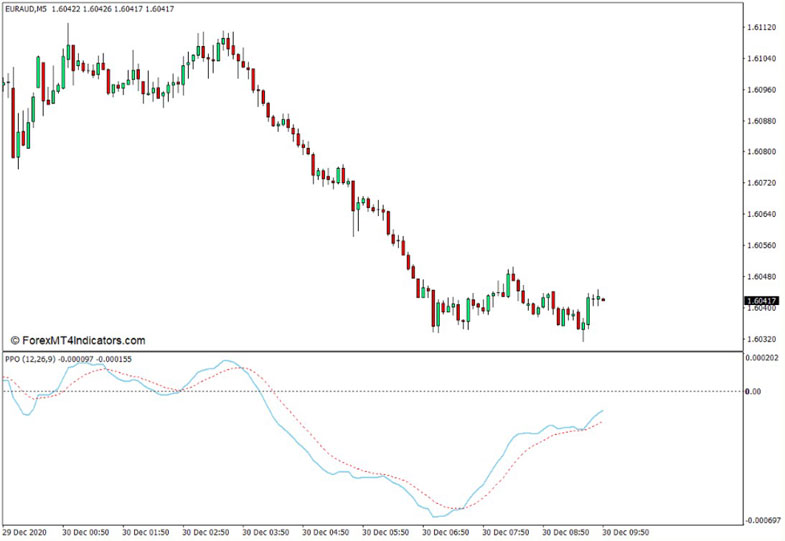
Pay attention to the PPO line crossing above or below the zero line. When the PPO line crosses above zero, it indicates that the short-term EMA is gaining momentum relative to the long-term EMA. This suggests a potential bullish trend. Conversely, when the PPO line crosses below zero, it indicates a loss of momentum in the short-term EMA, possibly signaling a bearish trend.
Bullish and Bearish Divergences
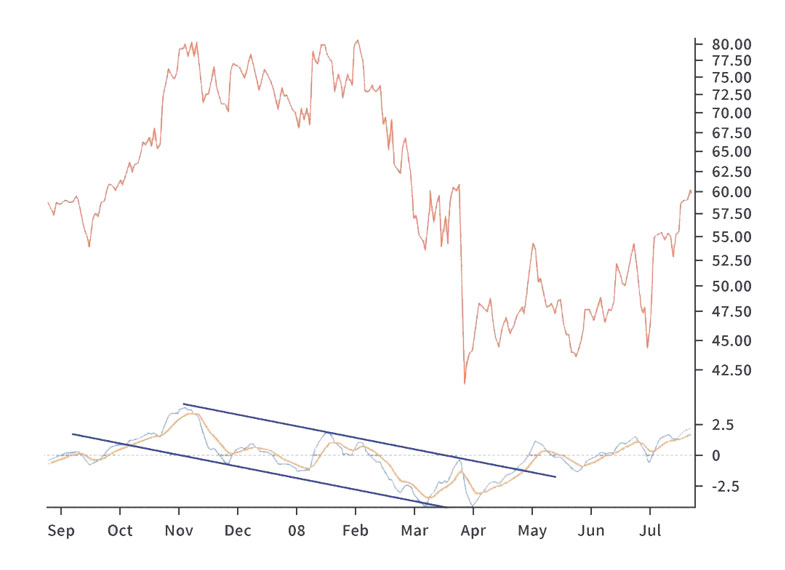
Look for divergences between the PPO line and the price chart. If the PPO line moves in the opposite direction to the price chart, it could signify a potential reversal or divergence in price momentum. For example, if the price is making higher highs while the PPO line is making lower highs, it may indicate a bearish divergence. Conversely, a bullish divergence occurs when the price makes lower lows while the PPO line makes higher lows. These divergences can provide valuable trading signals.
Overbought and Oversold Conditions
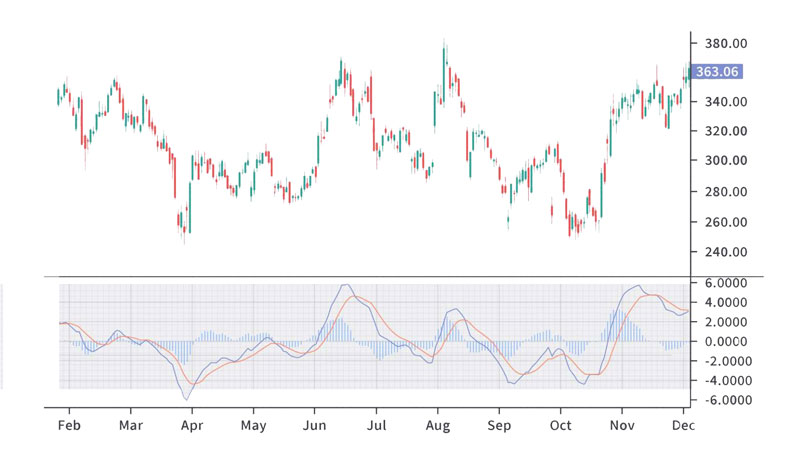
Monitor extreme values on the PPO line. When the PPO line reaches high positive percentages, it suggests an overbought condition, indicating that the price has deviated significantly above the average. This may indicate a potential reversal or correction. Conversely, when the PPO line reaches high negative percentages, it suggests an oversold condition, indicating the price has fallen well below the average. This can indicate a potential buying opportunity.
Confirmation with Other Indicators
Combine the analysis of the PPO with other technical indicators or analysis techniques to strengthen your trading decisions. Consider using tools such as support and resistance levels, trend lines, or volume indicators to confirm the signals generated by the PPO.
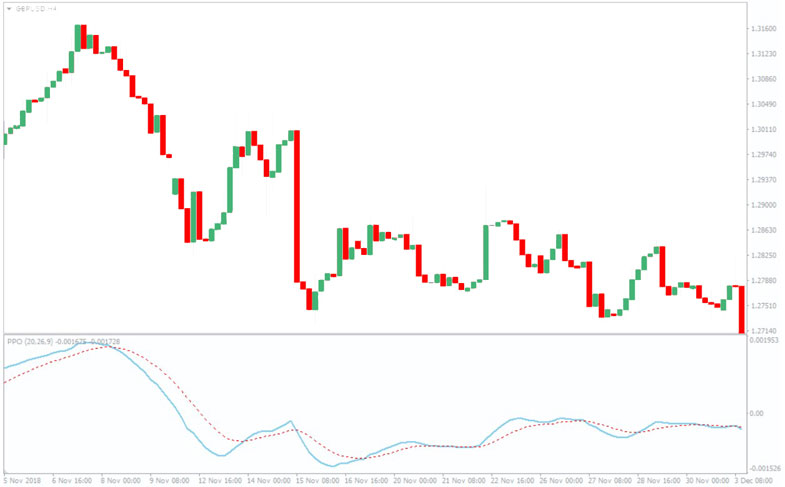
Needless to mention that this indicator, the same as others, isn't bulletproof and to reach a more precise decision it is best to combine with other factors.
Conclusion
The Percentage Price Oscillator is a practical momentum tool that converts moving average differences into comparable percentage readings. Its crossovers, zero-line signals, and histogram help traders understand when momentum is building, fading, or shifting direction. Because the scale is consistent, it suits traders who analyse several markets and want a single, reliable yardstick.
No indicator predicts the future, and the PPO is no exception, particularly during choppy and range-bound market conditions. Combining it with trend analysis, support and resistance, and disciplined risk control produces more consistent trading decisions. Practising on a demo account first lets you learn how the signals behave before committing real money.
To go further, explore related indicators like MACD, RSI, and Stochastic Oscillator, and compare how each reads momentum. Over time, you will learn which settings and timeframes fit your own style and the instruments you trade. Treat the PPO as one helpful piece of a complete trading plan rather than a shortcut to guaranteed profits.
FAQ
What is the Percentage Price Oscillator used for?
The Percentage Price Oscillator is used to measure momentum and trend strength by comparing a fast and a slow exponential moving average in percentage terms. Traders rely on it to spot crossovers, zero-line breaks, and possible trend reversals across forex, stocks, and indices.
How is the PPO different from the MACD?
Both indicators use the same moving average logic, but the MACD shows the difference in price units while the PPO shows it as a percentage. This makes the PPO better for comparing momentum between assets with very different price levels.
What are the best PPO settings?
The most common settings are 12, 26, and 9, which represent the fast average, slow average, and signal line periods. Shorter settings suit active short-term trading, while longer ones reduce noise and suit swing or position trading.
What does a PPO crossover mean?
A bullish crossover occurs when the PPO line moves above its signal line, suggesting momentum is turning upward. A bearish crossover occurs when it falls below the signal line, hinting that downward pressure may be increasing.
Can the PPO be used on forex and CFD markets?
Yes, the PPO works on any market and timeframe because it relies only on price data. Many forex and CFD traders use it alongside support and resistance levels, and test their settings on a demo account first.

Not sure about your Forex skills level?
Take a Test and We Will Help You With The Rest
You can see the graphical object on the price chart by downloading one of the trading terminals offered by IFC Markets.


Was this article helpful?

 You can study CFD trading more thoroughly and see CFD trading examples in the section How To Trade CFDs Visit Educational Center