- Phân tích dữ liệu
- Phân tích kỹ thuật thị trường
Tệ so với Rub Phân tích kỹ thuật - Tệ so với Rub Giao dịch: 2020-10-27
Tệ so với Rub Tổng quan phân tích kỹ thuật
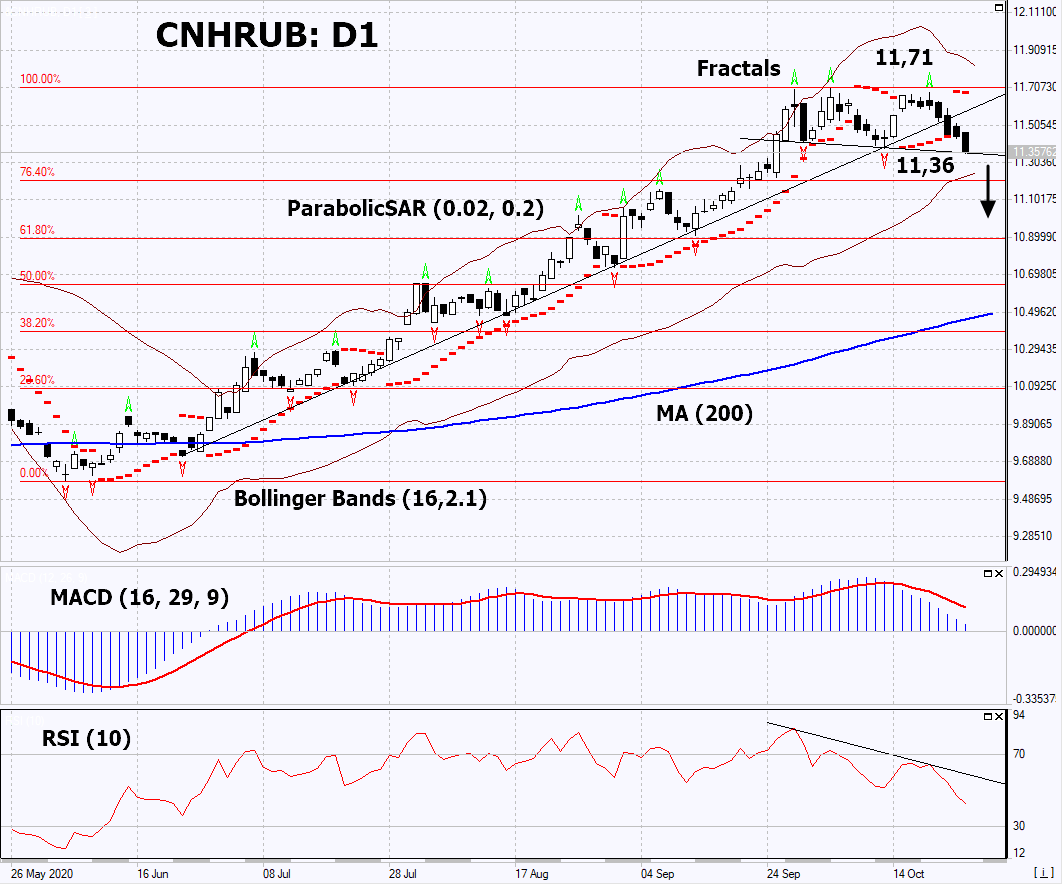
Dưới 11,36
Sell Stop
Trên 11,71
Stop Loss
| Chỉ thị | Tín hiệu |
| RSI | Trung lập |
| MACD | Bán |
| MA(200) | Trung lập |
| Fractals | Bán |
| Parabolic SAR | Bán |
| Bollinger Bands | Trung lập |
Tệ so với Rub Phân tích biểu đồ
Tệ so với Rub Phân tích kỹ thuật
On the daily timeframe, CNHRUB: D1 broke down the uptrend support line and is trying to correct downward from the maximum since February 2016. A number of technical analysis indicators generated signals for further decline. We do not rule out a bearish movement if CNHRUB falls below its latest minimum: 11.35. This level can be used as an entry point. We can place a stop loss above the maximum since February 2016, the last high fractal and the Parabolic signal: 11.71. After opening a pending order, we move the stop loss to the next fractal maximum following the Bollinger and Parabolic signals. Thus, we change the potential profit/loss ratio in our favor. After the transaction, the most risk-averse traders can switch to the 4-hour chart and set a stop loss, moving it in the direction of the bias. If the price meets the stop loss (11.71) without activating the order (11.35), it is recommended to delete the order: some internal changes in the market have not taken been into account.
Phân tích vĩ mô PCI - Tệ so với Rub
In this review, we propose to consider the "&CNHRUB" Personal Composite Instrument (PCI). It reflects the price dynamics of the Chinese yuan against the Russian ruble. Will the CNHRUB quotes continue to decrease?
The downward movement means the strengthening of the ruble and the weakening of the yuan. The Chinese currency was slightly lower amid the data on GDP growth for the 3rd quarter by 4.9% qoq, though it was expected to amount to 5.2%. Russian's current yield on 10-year government bonds is 6.2% (in rubles). In China, it is lower, at 3.2% (in yuan). Perhaps the dynamics of this PCI may depend on strengthening or softening of US sanctions against Russia or China after the US presidential election. In the meantime, Chinese authorities have expressed concern about the renminbi’s excessive rise to a 27-month maximum against the greenback. In theory, People’s Bank of China can take any steps to ease the monetary policy. The Bank of Russia, on the contrary, strives to support the ruble exchange rate. Since early 2020, it has already collapsed by almost a quarter amid falling world oil prices due to the coronavirus pandemic.
Explore our
Trading Conditions
- Spreads from 0.0 pip
- 30,000+ Trading Instruments
- Stop Out Level - Only 10%
Ready to Trade?
Open Account Lưu ý:
Bài tổng quan này mang tính chất tham khảo và được đăng miễn phí. Tất cả các dự liệu trong bài viết được lấy từ các nguồn thông tin mở và được công nhận đang tin cậy. Nhưng không có bất kỳ đảm bảo nào rằng thông tín hoàn toàn đang tin cậy. Sau này không điều chỉnh lại nữa. Tất cả thông tin trong bài tổng quan, bao gồm ý kiến, chỉ số, biểu đồ và khác chỉ mang tính chất tham khảo và không phải là lời khuyên đầu tư. Tất cả bài viết này không được xem xét như lời khuyên thúc đẩy để giao dịch. Công ty IFC Markets và nhân viên không chịu trách nghiệm cho bất kỳ quyết định của khách hàng sau khi đọc xong bài tổng quan.

