- Phân tích dữ liệu
- Phân tích kỹ thuật thị trường
USD/CAD Phân tích kỹ thuật - USD/CAD Giao dịch: 2020-09-22
USD/CAD Tổng quan phân tích kỹ thuật
Trên 1,333
Buy Stop
Dưới 1,299
Stop Loss
| Chỉ thị | Tín hiệu |
| RSI | Trung lập |
| MACD | Mua |
| MA(200) | Trung lập |
| Fractals | Mua |
| Parabolic SAR | Mua |
| Bollinger Bands | Mua |
USD/CAD Phân tích biểu đồ
USD/CAD Phân tích kỹ thuật
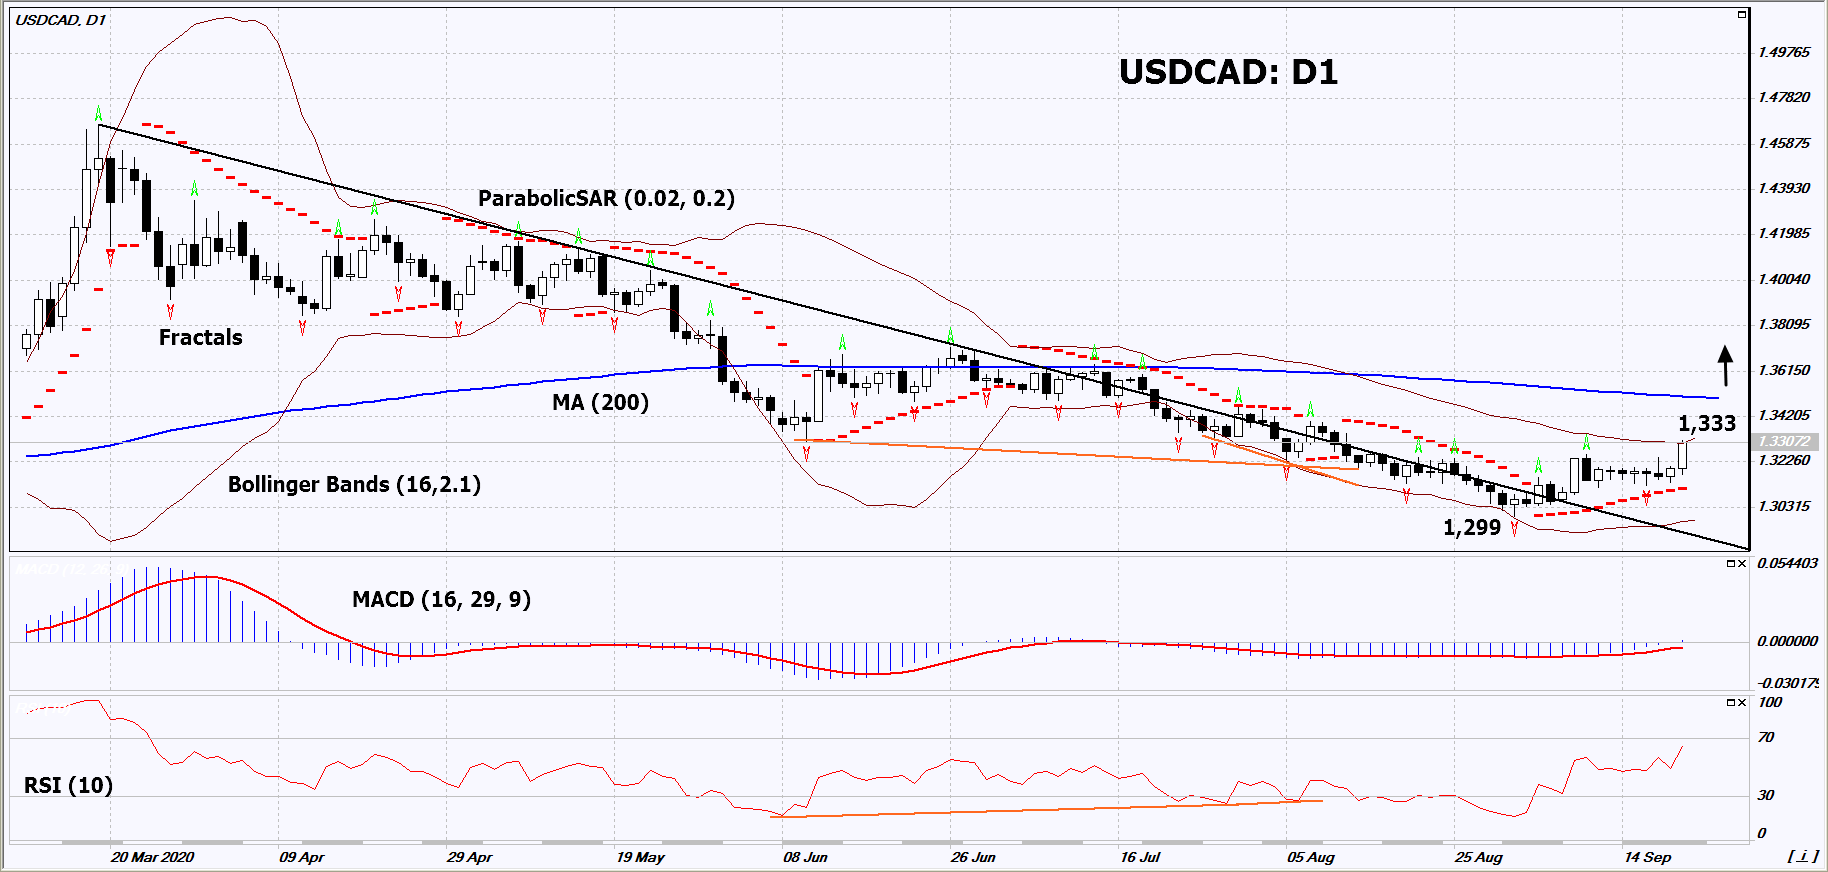
On the daily timeframe, USDCAD: D1 exceeded the downtrend resistance line. A number of technical analysis indicators formed signals for further growth. We do not exclude a bullish movement if USDCAD rises above the upper Bollinger band: 1.333. This level can be used as an entry point. We can place a stop loss below the Parabolic signal, the lower Bollinger band and the last two lower fractals: 1.299. After opening a pending order, we can move the stop loss to the next fractal low following the Bollinger and Parabolic signals. Thus, we change the potential profit/loss ratio in our favor. After the transaction the most risk-averse traders can switch to the four-hour chart and set a stop loss, moving it in the direction of the bias. If the price meets the stop loss (1.299) without activating the order (1.333), it is recommended to delete the order: some internal changes in the market have not been taken into account.
Phân tích vĩ mô Forex - USD/CAD
The Canadian economy is showing signs of slowing recovery from the coronavirus pandemic. Will the USDCAD quotes rise?
The upward movement means the weakening of the Canadian dollar. At the end of last week data on retail sales and ADP's negative data on the labor market were released in Canada. The number of jobs in August fell for the 6th month in a row (-205.4 thousand). Retail sales in Canada increased by 0.6% in July. This is much less than the 22.7% growth in June. No significant Canadian macroeconomic data is expected this week. However, the emerging correction in world oil prices may support the sliding of the Canadian dollar. Oil is getting cheaper in anticipation of increased production in Libya, as well as amid the increase in the number of new coronavirus cases worldwide. This may strengthen quarantine measures in some countries and weaken global demand. The U.S. Energy Information Administration notes a 13% decline in current US oil demand compared to 2019, and a 20% decrease in motor fuel demand. The International Energy Agency (IEA) projects a drop in the total global oil consumption in 2020 to 91.7 million barrels per day from 100.1 million in 2019. At the same time, according to the IEA, the recovery of global demand to last year's level may occur no earlier than 2023.
Explore our
Trading Conditions
- Spreads from 0.0 pip
- 30,000+ Trading Instruments
- Stop Out Level - Only 10%
Ready to Trade?
Open Account Lưu ý:
Bài tổng quan này mang tính chất tham khảo và được đăng miễn phí. Tất cả các dự liệu trong bài viết được lấy từ các nguồn thông tin mở và được công nhận đang tin cậy. Nhưng không có bất kỳ đảm bảo nào rằng thông tín hoàn toàn đang tin cậy. Sau này không điều chỉnh lại nữa. Tất cả thông tin trong bài tổng quan, bao gồm ý kiến, chỉ số, biểu đồ và khác chỉ mang tính chất tham khảo và không phải là lời khuyên đầu tư. Tất cả bài viết này không được xem xét như lời khuyên thúc đẩy để giao dịch. Công ty IFC Markets và nhân viên không chịu trách nghiệm cho bất kỳ quyết định của khách hàng sau khi đọc xong bài tổng quan.

